

Patients with obstructive sleep apnea syndrome usually present with changes in upper airway morphology and/or body fat distribution, which may occur throughout life and increase the severity of obstructive sleep apnea syndrome with age.
ObjectiveTo correlate cephalometric and anthropometric measures with obstructive sleep apnea syndrome severity in different age groups.
MethodsA retrospective study of cephalometric and anthropometric measures of 102 patients with obstructive sleep apnea syndrome was analyzed. Patients were divided into three age groups (≥20 and <40 years, ≥40 and <60 years, and ≥60 years). Pearson's correlation was performed for these measures with the apnea–hypopnea index in the full sample, and subsequently by age group.
ResultsThe cephalometric measures MP-H (distance between the mandibular plane and the hyoid bone) and PNS-P (distance between the posterior nasal spine and the tip of the soft palate) and the neck and waist circumferences showed a statistically significant correlation with apnea–hypopnea index in both the full sample and in the ≥40 and <60 years age group. These variables did not show any significant correlation with the other two age groups (<40 and ≥60 years).
ConclusionCephalometric measurements MP-H and PNS-P and cervical and waist circumferences correlated with obstructive sleep apnea syndrome severity in patients in the ≥40 and <60 age group.
Pacientes com a síndrome da apneia hipopneia obstrutiva do sono (SAOS) geralmente apresentam alterações na morfologia das vias aéreas superiores e/ou na distribuição da gordura corporal, que podem ocorrer durante a vida e aumentar a gravidade da SAOS com a idade.
ObjetivoCorrelacionar medidas cefalométricas e antropométricas com a gravidade da SAOS em diferentes faixas etárias.
MétodoEstudo retrospectivo de medidas cefalométricas e antropométricas de 102 pacientes portadores de SAOS. Os pacientes foram divididos em três faixas etárias (≥20 e <40 anos, ≥40 e <60 anos, e ≥60 anos). Foi realizada correlação de Pearson destas medidas com o índice de apneia hipopneia (IAH) na amostra completa e depois por faixa etária.
ResultadosAs medidas cefalométricas MP-H (distância entre o plano mandibular e o osso hioide) e PNS-P (distância entre a espinha nasal posterior e a ponta do palato mole) e as circunferências cervical e abdominal apresentaram correlação estatisticamente significante com o IAH tanto na amostra total quanto na faixa de <40 e ≥ 60 anos. Estas variáveis não mostraram correlação significante com as outras duas faixas etárias (≤ 40 e ≥ 60 anos).
ConclusãoAs medidas cefalométricas MP-H e PNS-P e as circunferências cervical e abdominal apresentaram correlação com a gravidade da SAOS em pacientes na faixa etária de ≥40 e <60 anos.
There is consensus in the medical literature that the severity of obstructive sleep apnea syndrome (OSAS) is related to age1–7; however, there have been few studies evaluating the changes that may occur in craniofacial morphology and anthropometric measures in adult patients with respect to age, and there is no standardization of criteria to define the age ranges for the groups of adults studied.5,8
Changes in upper airway morphology occur throughout adulthood and may be one factor explaining the increased prevalence of OSAS in older ages.9
Cephalometric X-rays have been used to investigate the topographic diagnosis of OSAS,10,11 as they are useful in the assessment of upper airway morphology, and are too low in cost and readily available in most hospitals and radiology centers.2,12,13
Certain anthropometric features are associated with the prevalence of OSAS. Thus, measurements of body mass index (BMI), neck circumference (NC), waist circumference (WC), and pelvic circumference (PC) have been analyzed by several authors as predictors of OSAS severity,14–16 with obesity considered a predictive factor.6
According to a study conducted by the World Health Organization (WHO)17 on the nutritional diagnosis of the population, adulthood is divided into two groups: adult, from 20 to less than 60 years of age, and the elderly, over 60 years of age, each with different BMI values. This division was based on the finding that with advancing age, individuals show a decline in height and weight due to compression of the intervertebral discs, loss of muscle tone and mass, reduction of body water, and postural alterations.
Because the literature3,5,8 exhibited very few studies correlating anthropometric and cephalometric measures with OSAS severity, and there was a lack of standardization of age ranges for adult subjects in these studies, we proposed this study with the objective of correlating cephalometric and anthropometric measures with OSAS severity in different age ranges.
MethodsThis was a longitudinal, historical cohort study that reviewed medical records of patients with OSAS, treated at a private otorhinolaryngology clinic in the period from July 2010 to July 2013. The total number of patients attended to during this period was 208, but 106 were excluded because of incomplete data, prior surgical treatment for OSAS, the use of continuous positive airway pressure (CPAP) equipment or an intraoral appliance (IOA), the use of sedatives or alcoholism. The final sample consisted of 102 patients, 57 males and 45 females, aged 20–70 years. This study was approved by the Ethics Committee in Research, No. 248.678.
Polysomnography was carried out using a Somté Compumedics® device with all-night domiciliary monitoring, using the level II parameters of the American Sleep Disorders Association.18
Patients were considered as having OSAS if, in addition to clinical complaints, they had an apnea–hypopnea index (AHI) ≥5.19 Severity was measured by the AHI. Cephalometry was performed with the Orthophos 3 device, manufactured by Sirona, with manual tracing.
The cephalometric measurements used were: PAS, the space between the base of the tongue and the posterior pharyngeal wall; MP-H, the distance between the mandibular plane and the hyoid bone; SNA, the angle formed by the union of the S point, which is the midpoint of the sella turcica, with point N, which corresponds to the union between the frontal and nasal bones, and point A, which is the most posterior point on the anterior surface of the maxilla; SNB, the angle formed by the union of the S point with the N point and the B point, which is the most posterior point of the anterior surface of the mandible; ANB, difference between SNA and SNB; PNS-P, distance between the posterior nasal spine and the tip of the soft palate.10–12,20 The following anthropometric measures were assessed: BMI, NC, WC, and PC. BMI is defined as the ratio of the weight of the individual in kg and the square of height in meters. Cervical circumference (CC) was measured at the level of the cricothyroid membrane. WC was measured between the last rib and the iliac crest, while the PC was measured at the largest circumference at the level of the trochanter edge.21
Due to the lack of standardization of the age range division in adults with OSAS in this study, the division by age group was based on that reported by the WHO,17 which takes into account the evaluation of nutritional status and considers an adult as an individual aged between 20 and 60 years, and as elderly, an individual aged ≥60 years. However, as the interval between 20 and 60 years is broad and all are considered adults in this study, this study used a 20-year interval, as follows:
Group 1: ≥20 and <40 years;
Group 2: ≥40 and <60 years;
Group 3: ≥60 years.
The data were entered into a database, using SPSS software, release 16.0, which calculated the simple descriptive statistics such as percentage distribution, mean, and standard deviation. The normality test (Kolmogorov–Smirnov) was applied and the appropriate test for each type of variable (parametric or nonparametric) was chosen. Pearson's correlation was assessed between AHI and the variables age, BMI, CC, WC, PC, and cephalometric measures (SNA, SNB, ANB, MP-H, PAS, and PNS-P). The differences regarding gender were compared by Student's t-test. The level of significance was set at p<0.05.
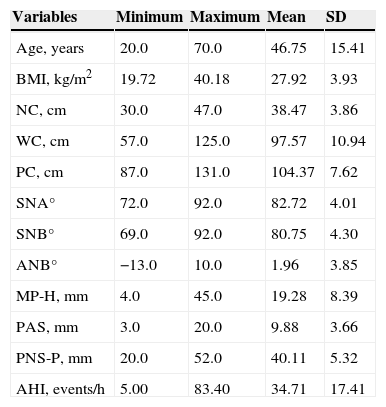
ResultsThe age of patients ranged from 20 to 70 years, with a mean of 46.75±15.41 years, and variation was observed regarding the means of the studied variables (Table 1).
Mean and standard deviation of age, apnea–hypopnea index (AHI), and anthropometric and cephalometric variables of 102 patients.
| Variables | Minimum | Maximum | Mean | SD |
|---|---|---|---|---|
| Age, years | 20.0 | 70.0 | 46.75 | 15.41 |
| BMI, kg/m2 | 19.72 | 40.18 | 27.92 | 3.93 |
| NC, cm | 30.0 | 47.0 | 38.47 | 3.86 |
| WC, cm | 57.0 | 125.0 | 97.57 | 10.94 |
| PC, cm | 87.0 | 131.0 | 104.37 | 7.62 |
| SNA° | 72.0 | 92.0 | 82.72 | 4.01 |
| SNB° | 69.0 | 92.0 | 80.75 | 4.30 |
| ANB° | −13.0 | 10.0 | 1.96 | 3.85 |
| MP-H, mm | 4.0 | 45.0 | 19.28 | 8.39 |
| PAS, mm | 3.0 | 20.0 | 9.88 | 3.66 |
| PNS-P, mm | 20.0 | 52.0 | 40.11 | 5.32 |
| AHI, events/h | 5.00 | 83.40 | 34.71 | 17.41 |
SD, standard deviation; BMI, body mass index; NC, neck circumference; WC, waist circumference; PC, pelvic circumference; SNA, sella-nasion-A point angle; SNB, sella-nasion-B point angle; ANB, difference between SNA and SNB; MP-H, distance between the mandibular plane and the hyoid bone; PAS, space between the base of the tongue and the posterior pharyngeal wall; PNS-P, distance between the posterior nasal spine and the tip of the soft palate; AHI, apnea–hypopnea index.
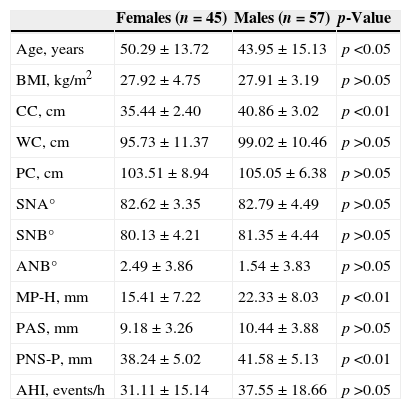
Of the 102 patients studied, 57 (55.9%) were males and 45 (44.1%) were females. When comparing age and anthropometric and cephalometric measures between men and women using Student's t-test, a statistically significant difference was found for age, for NC, and for cephalometric MP-H and PNS-P (Table 2).
Comparison between males and females of age, anthropometric and cephalometric measurements, and AHI.
| Females (n=45) | Males (n=57) | p-Value | |
|---|---|---|---|
| Age, years | 50.29±13.72 | 43.95±15.13 | p<0.05 |
| BMI, kg/m2 | 27.92±4.75 | 27.91±3.19 | p>0.05 |
| CC, cm | 35.44±2.40 | 40.86±3.02 | p<0.01 |
| WC, cm | 95.73±11.37 | 99.02±10.46 | p>0.05 |
| PC, cm | 103.51±8.94 | 105.05±6.38 | p>0.05 |
| SNA° | 82.62±3.35 | 82.79±4.49 | p>0.05 |
| SNB° | 80.13±4.21 | 81.35±4.44 | p>0.05 |
| ANB° | 2.49±3.86 | 1.54±3.83 | p>0.05 |
| MP-H, mm | 15.41±7.22 | 22.33±8.03 | p<0.01 |
| PAS, mm | 9.18±3.26 | 10.44±3.88 | p>0.05 |
| PNS-P, mm | 38.24±5.02 | 41.58±5.13 | p<0.01 |
| AHI, events/h | 31.11±15.14 | 37.55±18.66 | p>0.05 |
BMI, body mass index; CC, cervical circumference; WC, waist circumference; PC, pelvic circumference; SNA, sella-nasion-A point angle; SNB, sella-nasion-B point angle; ANB, difference between SNA and SNB; MP-H, distance between the mandibular plane and the hyoid bone; PAS, space between the base of the tongue and the posterior pharyngeal wall; PNS-P, distance between the posterior nasal spine and the tip of the soft palate.
When comparing age and anthropometric and cephalometric measures between men and women using Student's t-test, a statistically significant difference was observed for age, NC, and the cephalometric measures MP-H and PNS-P (Table 2).
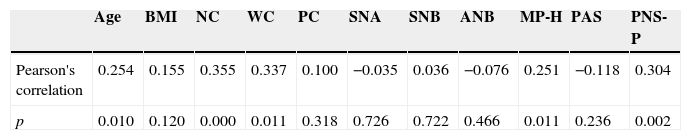
Table 3 shows the analysis of Pearson's correlation between age and anthropometric and cephalometric measures with AHI in the full sample. There was a statistically significant correlation with age, with NC and WC, and with the cephalometric measures MP-H and PNS-P, i.e., the higher the value of these variables, the higher the AHI value. There was no significant correlation with BMI.
Correlation of age and anthropometric and cephalometric measurements with the AHI in the full sample (n=102).
| Age | BMI | NC | WC | PC | SNA | SNB | ANB | MP-H | PAS | PNS-P | |
|---|---|---|---|---|---|---|---|---|---|---|---|
| Pearson's correlation | 0.254 | 0.155 | 0.355 | 0.337 | 0.100 | −0.035 | 0.036 | −0.076 | 0.251 | −0.118 | 0.304 |
| p | 0.010 | 0.120 | 0.000 | 0.011 | 0.318 | 0.726 | 0.722 | 0.466 | 0.011 | 0.236 | 0.002 |
BMI, body mass index; NC, neck circumference; WC, waist circumference; PC, pelvic circumference; SNA, sella-nasion-A point angle; SNB, sella-nasion-B point angle; ANB, difference between SNA and SNB; MP-H, distance between the mandibular plane and the hyoid bone; PAS, space between the base of the tongue and the posterior pharyngeal wall; PNS-P, distance between the posterior nasal spine and the tip of the soft palate.
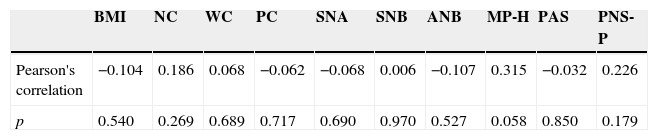
Table 4 shows the analysis of Pearson's correlation to assess the association, in the age range of ≥20 and <40 years, of anthropometric and cephalometric measures with AHI. There was no significant correlation with any of the variables.
Correlation in the age range ≥20 and <40 years of anthropometric and cephalometric measurements with AHI (n=37).
| BMI | NC | WC | PC | SNA | SNB | ANB | MP-H | PAS | PNS-P | |
|---|---|---|---|---|---|---|---|---|---|---|
| Pearson's correlation | −0.104 | 0.186 | 0.068 | −0.062 | −0.068 | 0.006 | −0.107 | 0.315 | −0.032 | 0.226 |
| p | 0.540 | 0.269 | 0.689 | 0.717 | 0.690 | 0.970 | 0.527 | 0.058 | 0.850 | 0.179 |
BMI, body mass index; NC, neck circumference; WC, waist circumference; PC, pelvic circumference; SNA, sella-nasion-A point angle; SNB, sella-nasion-B point angle; ANB, difference between SNA and SNB; MP-H, distance between the mandibular plane and the hyoid bone; PAS, space between the base of the tongue and the posterior pharyngeal wall; PNS-P, distance between the posterior nasal spine and the tip of the soft palate.
Table 5 shows the analysis of Pearson's correlation to assess the association, in the age of range of ≥40 and <60 years, of anthropometric and cephalometric measures with AHI. It can be observed that all anthropometric and cephalometric variables that showed significant correlations in the full sample, with 102 patients, also showed such correlations in this age range.
Correlation in the age range ≥40 and <60 years of anthropometric and cephalometric measurements with AHI (n=39).
| BMI | NC | WC | PC | SNA | SNB | ANB | MP-H | PAS | PNS-P | |
|---|---|---|---|---|---|---|---|---|---|---|
| Pearson's correlation | 0.290 | 0.574 | 0.492 | 0.338 | −0.083 | 0.118 | −0.042 | 0.380 | −0.021 | 0.379 |
| p | 0.073 | 0.000 | 0.001 | 0.035 | 0.597 | 0.473 | 0.801 | 0.017 | 0.900 | 0.017 |
BMI, body mass index; NC, neck circumference; WC, waist circumference; PC, pelvic circumference; SNA, sella-nasion-A point angle; SNB, sella-nasion-B point angle; ANB, difference between SNA and SNB; MP-H, distance between the mandibular plane and the hyoid bone; PAS, space between the base of the tongue and the posterior pharyngeal wall; PNS-P, distance between the posterior nasal spine and the tip of the soft palate.
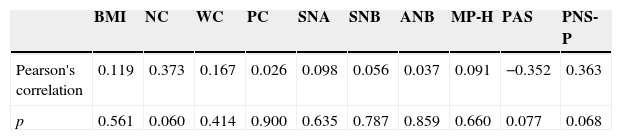
Table 6 shows the analysis of Pearson's correlation to assess the association, in the age range ≥60 years, of anthropometric and cephalometric measures with AHI. There was no significant correlation with any of the variables.
Correlation in the age range ≥60 years of anthropometric and cephalometric measures with AHI (n=26).
| BMI | NC | WC | PC | SNA | SNB | ANB | MP-H | PAS | PNS-P | |
|---|---|---|---|---|---|---|---|---|---|---|
| Pearson's correlation | 0.119 | 0.373 | 0.167 | 0.026 | 0.098 | 0.056 | 0.037 | 0.091 | −0.352 | 0.363 |
| p | 0.561 | 0.060 | 0.414 | 0.900 | 0.635 | 0.787 | 0.859 | 0.660 | 0.077 | 0.068 |
BMI, body mass index; NC, neck circumference; WC, waist circumference; PC, pelvic circumference; SNA, sella-nasion-A point angle; SNB, sella-nasion-B point angle; ANB, difference between SNA and SNB; MP-H, distance between the mandibular plane and the hyoid bone; PAS, space between the base of the tongue and the posterior pharyngeal wall; PNS-P, distance between the posterior nasal spine and the tip of the soft palate.
Several factors can increase OSAS predisposition, such as obesity, which can cause fat deposition in upper airway tissues, reducing the nasopharyngeal caliber and/or leading to hypoventilation.6,22 Assessment of craniofacial morphology is frequently performed in studies with these patients, not only to identify the morphological alterations, but also to identify the site of the obstruction that can aid in selecting the appropriate treatment.13,23
There are several studies in the literature correlating age with the severity of OSAS1–7 and it is known that upper airway morphology alterations occur throughout adulthood,3,5,8,9,24,25 as well as in anthropometric measures,14–16 but most studies do not stratify patients by age groups, and in those that do so, there is no standardization of criteria for this division.3,5,8,26
In the present study, when the full cohort of patients was evaluated together without division by age range, a significant correlation was observed between AHI with age and with NC, in agreement with other studies2,3,5,15,16,27–32; the same significant correlation was noted for WC.2,4,5,15,28–30 There was no correlation with BMI, as reported in most studies,1–4,6–8,15,29–34 although some studies have demonstrated results similar to ours.5,27
There was also a significant correlation with cephalometric measures MP-H and PNS-P with AHI, in agreement with other studies, meaning that these patients have an increased length of the soft palate and increased distance from the hyoid bone to the mandible.2,8,24,35,36 The position of the hyoid bone has an impact on the shape and position of the tongue and affects the patency of the hypopharyngeal airway27; it is also used as a predictor of therapeutic efficacy of mandibular advancement appliance (MAA) in patients with mild to moderate OSAS.37 Approximately 80% of patients with OSAS have retropalatal obstruction38 and it is known that when the PNS-P measurement is increased, it is used to predict a positive response to uvulopalatopharyngoplasty.39
When patients were divided by age range, those aged ≥20 <40 years and ≥60 years showed no significant correlation of cephalometric and anthropometric measures with AHI. However, a significant correlation was observed between AHI with age and with NC in the age group of ≥40 and <60 years which also had been observed in the sample as a whole.
When comparing the full sample by gender, a significant correlation with NC was observed in males, in agreement with other studies,7,15,26,27,40 while BMI and WC did not differ between the genders, in agreement with another study.40 The cephalometric measures MP-H and PNS-P were higher in male patients, in agreement with the assessed literature.7,27
In a study involving 60 men and 54 healthy women ranging in age from 16 to 74 years, with a mean of 35 years, it was observed that there was a decrease in the dimensions of the upper airways with increasing age in both genders, except in the oropharyngeal junction; however, there was greater upper airway collapse in the oropharyngeal junction in the male gender.26
The pharynx was evaluated by cephalometry in young adults. After 32 years, the individuals were reassessed, which disclosed a reduction in the oropharyngeal airway caused by the increase of the soft palate (PNS-P), a fact that would justify the increased prevalence of OSAS with age.9 Maltais et al.24 also observed abnormalities in older patients, with increased MP-H distance in older patients.
When analyzing patients at different age groups, Mayer et al.8 observed upper airway alterations. They found that in younger and slimmer patients, upper airway abnormalities explained most AHI variance. In more obese and older patients that did not have upper airway abnormalities, but had OSAS, they suggest that other physiopathological mechanisms are responsible, such as primary respiratory conditions and unstable neurological mechanisms.
When analyzing 433 patients with OSAS by age range (<43, 43–52, and >52 years), Montoya et al.3 found that patients aged >52 years were 3.8 times more likely to have OSAS than younger individuals (<43 years), which was statistically significant.
Another study evaluated 163 normal male subjects aged 30–72 years. They were reassessed after ten years and it was found that the position of the hyoid bone changed with age, with a significant increase in dolichofacial individuals.25
ConclusionThe cephalometric measures MP-H and PNS-P and anthropometric measures NC and WC correlated with OSAS severity in patients aged ≥40 and <60 years.
Conflicts of interestThe authors declare no conflicts of interest.
Please cite this article as: Borges PT, da Silva BB, Moita Neto JM, Borges NE, Li LM. Cephalometric and anthropometric data of obstructive apnea in different age groups. Braz J Otorhinolaryngol. 2015;81:79–84.
Institution: Universidade Federal do Piauí (UFPI), Teresina, PI, Brazil.
gology is pleased to honor the reviewers


