
The natural aging process may result in morphological changes in the vestibular system and in the afferent neural pathway, including loss of hair cells, decreased numbers of vestibular nerve cells, and loss of neurons in the vestibular nucleus. Thus, with advancing age, there should be a decrease in amplitudes and an increase in latencies of the vestibular evoked myogenic potentials, especially the prolongation of p13 latency. Moreover, many investigations have found no significant differences in latencies with advancing age.
ObjectiveTo determine if there are significant differences in the latencies of cervical and ocular evoked myogenic potentials between elderly and adult patients.
MethodsThis is a systematic review with meta-analysis of observational studies, comparing the differences of these parameters between elderly and young adults, without language or date restrictions, in the following databases: Pubmed, ScienceDirect, SCOPUS, Web of Science, SciELO and LILACS, in addition to the gray literature databases: OpenGrey.eu and DissOnline, as well as Research Gate.
ResultsThe n1 oVEMP latencies had a mean delay in the elderly of 2.32ms with 95% CI of 0.55–4.10ms. The overall effect test showed p=0.01, disclosing that such difference was significant. The heterogeneity found was I2=96% (p<0.001). Evaluation of p1 latency was not possible due to the low number of articles selected for this condition. cVEMP analysis was performed in 13 articles. For the p13 component, the mean latency delay in the elderly was 1.34ms with 95% CI of 0.56–2.11ms. The overall effect test showed a p<0.001, with heterogeneity value I2=92% (p<0.001). For the n23 component, the mean latency delay for the elderly was 2.82ms with 95% CI of 0.33–5.30ms. The overall effect test showed p=0.03. The heterogeneity found was I2=99% (p<0.001).
ConclusionThe latency of oVEMP n1 wave component and latencies of cVEMP p13 and n23 wave components are longer in the elderly aged >60 years than in young adults.
O processo natural de envelhecimento pode resultar em mudanças morfológicas no sistema vestibular e na via neural aferente, incluindo perda de células ciliadas, diminuição do número de células do nervo vestibular e perda de neurônios no núcleo vestibular. Dessa forma, com o avanço da idade, deveria ocorrer diminuição nas amplitudes e aumento nas latências dos potenciais evocados miogênicos vestibulares (VEMP), principalmente o prolongamento da latência p13. Além disso, muitos artigos não encontraram diferenças significativas nas latências do VEMP, com o avanço da idade.
ObjetivoAnalisar se existem diferenças significativas para as latências do VEMP cervical (cVEMP) e do VEMP ocular (oVEMP) entre idosos e adultos.
MétodoRevisão sistemática com metanálise de estudos observacionais que comparam diferenças desses parâmetros entre idosos e adultos jovens, sem restrições de idiomas ou datas, nas seguintes bases de dados: Pubmed, ScienceDirect, Scopus, Web of Science, SciELO e Lilacs. Além das bases de literatura cinzenta: OpenGrey.eu e DissOnline, e ainda no Research Gate.
ResultadosAs latências n1 do oVEMP tiveram um atraso médio nos idosos de 2,32ms com IC 95% 0,55–4,10ms. O teste para o efeito geral obteve p=0,01 e revelou que tal diferença foi significativa. A heterogeneidade encontrada foi I2=96% (p<0,001). Avaliação da latência de p1 não foi possível devido ao baixo número de artigos selecionados para essa condição. A análise do cVEMP foi realizada com 13 artigos. Para o componente p13, o atraso médio para as latências dos idosos foi de 1,34ms com IC 95% 0,56–2,11ms. O teste para o efeito geral obteve p<0,001; com valor da heterogeneidade I2=92% (p<0,001). Para o componente n23, o atraso médio para as latências dos idosos foi de 2,82ms com IC 95% 0,33–5,30ms. O teste para o efeito geral obteve p=0,03. A heterogeneidade encontrada foi I2=99% (p<0,001).
ConclusãoA latência do componente de onda n1 do oVEMP e as latências dos componentes de onda p13 e n23 do cVEMP são mais prolongadas em idosos com idade >60 anos do que em adultos jovens.
The vestibular evoked myogenic potential (VEMP) is an objective, non-invasive examination with high-intensity auditory stimuli that assesses vestibular function integrity through the muscle reflex response.1–3
Recent advances in technology have allowed clinicians to assess the vestibular function capacity through the ocular (oVEMP) and cervical vestibular evoked myogenic potential (cVEMP).1,2
OVEMP is a short-latency potential that evaluates the utriculo-ocular reflex (upper vestibular nerve),3 whereas cVEMP is a medium-latency potential1 that evaluates the saccular-colic reflex (lower vestibular nerve).1–6 Thus, diseases that interfere with neural conduction from the inner ear, through the brainstem, the vestibulospinal tract and the second motor neuron, may interfere with the response. In view of this, the VEMP evaluates the final reflex; therefore, it cannot be used for the topographical diagnosis, but confirms or rules out the involvement of the affected pathway.7–10
As a basic evaluation principle of any evoked potential, the time between the stimulus and the response is measured, classifying it as normal or altered based on the duration time and the morphology of the generated electric waves.11–13
The tracing obtained consists of two biphasic wave complexes. In the cVEMP, the first biphasic potential has a positive peak (P) with a mean latency of 13 milliseconds (ms), followed by a negative peak (N) with a mean latency of 23ms, and it is called P13-N23; whereas the oVEMP shows a negative peak (N) with a mean latency of 10ms, followed by a positive peak (P) with a mean latency of 15ms, being called N10-P15.4,14–16 The interaural difference of peak latency is associated with the neuronal conduction velocity, and the increase in this difference could be explained by the asymmetry in this velocity, common in neurological diseases.17,18
Latency is the clinical parameter most often used in the analysis of VEMP responses, since it does not depend on stimulus intensity or the muscular tension level and has high reproducibility.1,19
With the natural aging process, morphological changes may occur in the vestibular system and the afferent neural pathway, including loss of hair cells, decreased numbers of vestibular nerve cells and loss of neurons in the vestibular nucleus.19–22 Therefore, with advancing age, there should be a decrease in amplitudes and an increase in latencies22 of these potentials, especially the prolongation of p13 latency. However, some authors report that VEMP latency cannot be affected by the otolytic function, but by the activation of the organ receptor.22 Additionally, many investigations did not find significant differences in VEMP latencies with advancing age.21,23–27 Therefore, the aim of this study was to determine if there are significant differences regarding cVEMP and oVEMP latencies between the elderly and young adults.
MethodsThe devising of this systematic review sought to answer the following question: Do the elderly have different latency values of cervical and ocular vestibular evoked myogenic potentials than adults? Based on this question, the review is reported according to the items of the Preferred Reporting Items for Systematic Reviews and Meta-Analyses Statement (PRISMA). A protocol was published in the PROSPERO database28 (http://www.crd.york.ac.uk/PROSPERO), under registration number CRD42016046991.
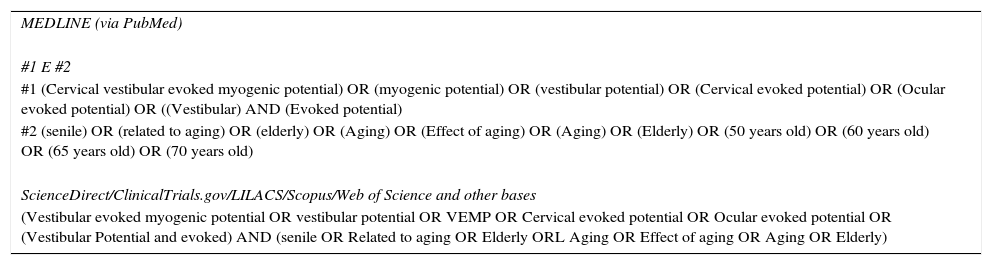
Search strategyThe strategy includes the descriptors (DECs and MESH) and Free terms (TL), based on the two first elements of PIC (Population, Interest, Context) present in the title, which consisted of: (senile OR Age-related OR Aged OR Aging OR Ageing Effect OR Ageing OR older) AND (vestibular evoked myogenic potential OR vestibular potential OR VEMP OR Cervical evoked potential OR Ocular evoked potential OR [Vestibular AND evoked AND Potential]). The complete strategy can be found in the supplementary material (Table 1).
Literature search strategy, used for all databases.
| MEDLINE (via PubMed) |
| #1 E #2 |
| #1 (Cervical vestibular evoked myogenic potential) OR (myogenic potential) OR (vestibular potential) OR (Cervical evoked potential) OR (Ocular evoked potential) OR ((Vestibular) AND (Evoked potential) |
| #2 (senile) OR (related to aging) OR (elderly) OR (Aging) OR (Effect of aging) OR (Aging) OR (Elderly) OR (50 years old) OR (60 years old) OR (65 years old) OR (70 years old) |
| ScienceDirect/ClinicalTrials.gov/LILACS/Scopus/Web of Science and other bases |
| (Vestibular evoked myogenic potential OR vestibular potential OR VEMP OR Cervical evoked potential OR Ocular evoked potential OR (Vestibular Potential and evoked) AND (senile OR Related to aging OR Elderly ORL Aging OR Effect of aging OR Aging OR Elderly) |
The searches were carried out between the months of July and August of 2016, and were revised in September of the same year. The following databases were searched: Pubmed, ScienceDirect, BVS (LILACS), SCOPUS, Circumpolar Health Bibliographic Database, SciELO and EMBASE, as well as the gray literature databases: OpenGrey.eu, DissOnline, The New York Academy of Medicine, as well as ReasearchGate. There was no manual search of the included articles and experts in the area were not contacted to avoid the risk of citation bias.29
Eligibility criteriaThe following were considered inclusion criteria: observational studies, with groups of elderly individuals, with age groups of 55 years or older, with control group, with latencies of ocular and/or cervical vestibular evoked myogenic potentials. Additionally, the potentials should be evoked by acoustic stimuli such as Click or 500Hz Toneburst, with intensity between 90 and 105dBNAn. Exclusion criteria were: conductive hearing loss, sensorineural hearing loss equal to or greater than 50dB at any frequency, control group with age group containing subjects 55 years of age or older, vestibular, neural pathologies, diabetes, or Parkinson's disease. Articles that were repeated in different databases were also excluded. Finally, studies with at least the title and/or abstract in English were included, but there was no restriction regarding language or date of publication.
Data extractionDuring the selection process, the titles and abstracts of the obtained articles were independently evaluated by two researchers who were not blinded to the authors or journal title. Disagreements were resolved by discussion. In cases where there was no consensus, a third author was asked to make the final decision. The full texts of potentially eligible articles were acquired and analyzed in full.
The outcome sought in the studies was the mean latency values of the biphasic components for cVEMP and/or oVEMP and in the second assessment, associated with a dispersion measure.
Data were analyzed from published articles and authors were contacted for additional information. In addition to the outcome data, we also obtained the names of the authors, title, year of publication, country, age ranges of the groups, number of subjects in each group, monitored muscles and auditory examinations. A standard form for data storage was created based on the model used by Cochran.30
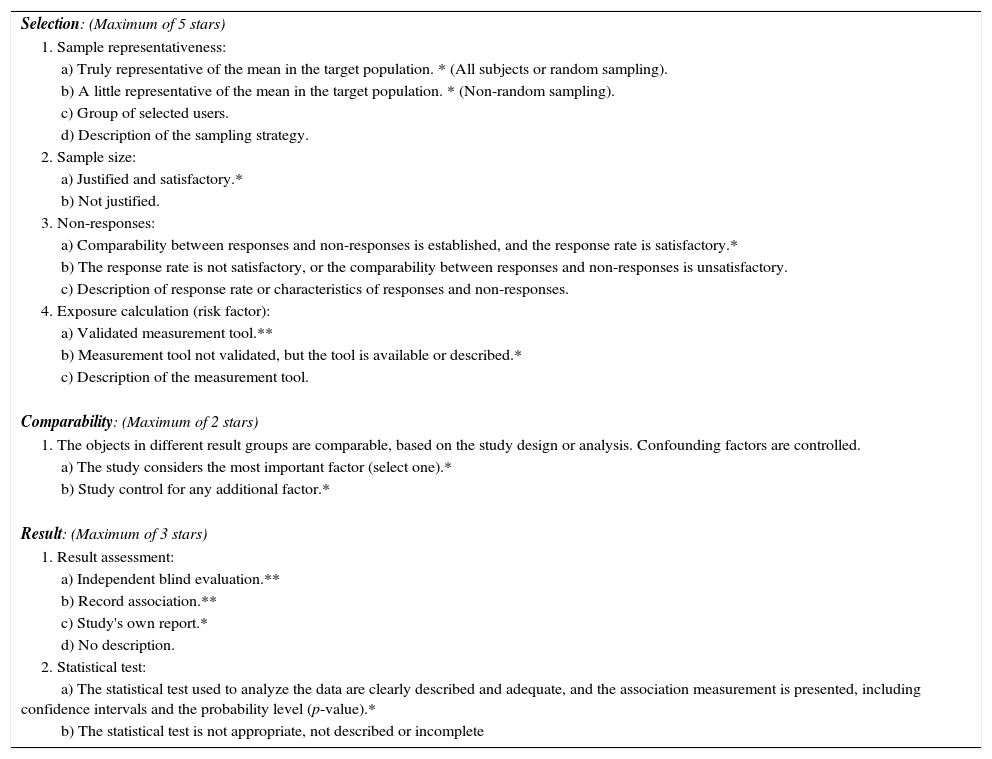
Assessment of bias riskThe risk of bias was assessed according to the recommendations of the “Newcastle-Ottawa” manual and scale,31 adapted for cross-sectional observational studies. The quality of the study was independently evaluated by two researchers and the divergences were resolved by consensus. The maximum score to be reached was ten points and the evaluated scale items were: (1) representativeness of the sample; (2) sample size; (3) management of non-responses; (4) exposure calculation (risk factor); (5) comparability, to investigate whether individuals in different groups of outcomes are comparable, based on study design or analysis, control of confounding factors; (6) evaluation of results and (7) statistical test (Table 2).
Newcastle-Ottawa Scale (adapted) for quality assessment of cross-sectional studies.
| Selection: (Maximum of 5 stars) |
| 1. Sample representativeness: |
| a) Truly representative of the mean in the target population. * (All subjects or random sampling). |
| b) A little representative of the mean in the target population. * (Non-random sampling). |
| c) Group of selected users. |
| d) Description of the sampling strategy. |
| 2. Sample size: |
| a) Justified and satisfactory.* |
| b) Not justified. |
| 3. Non-responses: |
| a) Comparability between responses and non-responses is established, and the response rate is satisfactory.* |
| b) The response rate is not satisfactory, or the comparability between responses and non-responses is unsatisfactory. |
| c) Description of response rate or characteristics of responses and non-responses. |
| 4. Exposure calculation (risk factor): |
| a) Validated measurement tool.** |
| b) Measurement tool not validated, but the tool is available or described.* |
| c) Description of the measurement tool. |
| Comparability: (Maximum of 2 stars) |
| 1. The objects in different result groups are comparable, based on the study design or analysis. Confounding factors are controlled. |
| a) The study considers the most important factor (select one).* |
| b) Study control for any additional factor.* |
| Result: (Maximum of 3 stars) |
| 1. Result assessment: |
| a) Independent blind evaluation.** |
| b) Record association.** |
| c) Study's own report.* |
| d) No description. |
| 2. Statistical test: |
| a) The statistical test used to analyze the data are clearly described and adequate, and the association measurement is presented, including confidence intervals and the probability level (p-value).* |
| b) The statistical test is not appropriate, not described or incomplete |
This scale was adapted from the Newcastle-Ottawa Quality Assessment Scale for cohort studies to perform a quality assessment of cross-sectional studies for the systematic review, “Are healthcare workers’ intentions to vaccinate related to their knowledge, beliefs, and attitudes? A systematic review.”
The latency variation of the biphasic components for cVEMP and oVEMP of the two groups (elderly group and adult group) was compared by meta-analysis. For this purpose, a random effects model was used as a measure of the effect of the mean difference between the groups and as a statistical method of analysis. An α value of 0.05 was considered statistically significant. When it was not possible to obtain adequate data for analysis, Cochran's recommendations were followed.
The statistical heterogeneity between studies was tested using the Cochran's Q test and inconsistency was tested using the I2 test. A value of p<0.10 was considered statistically significant. When necessary, study characteristics considered potential sources of heterogeneity were included in a subgroup analysis. Furthermore, in the case of heterogeneity, studies were removed, one by one, to investigate whether that particular study was the source of heterogeneity.
All analyses were performed using RevMan 5.3 software (Cochrane Collaboration).
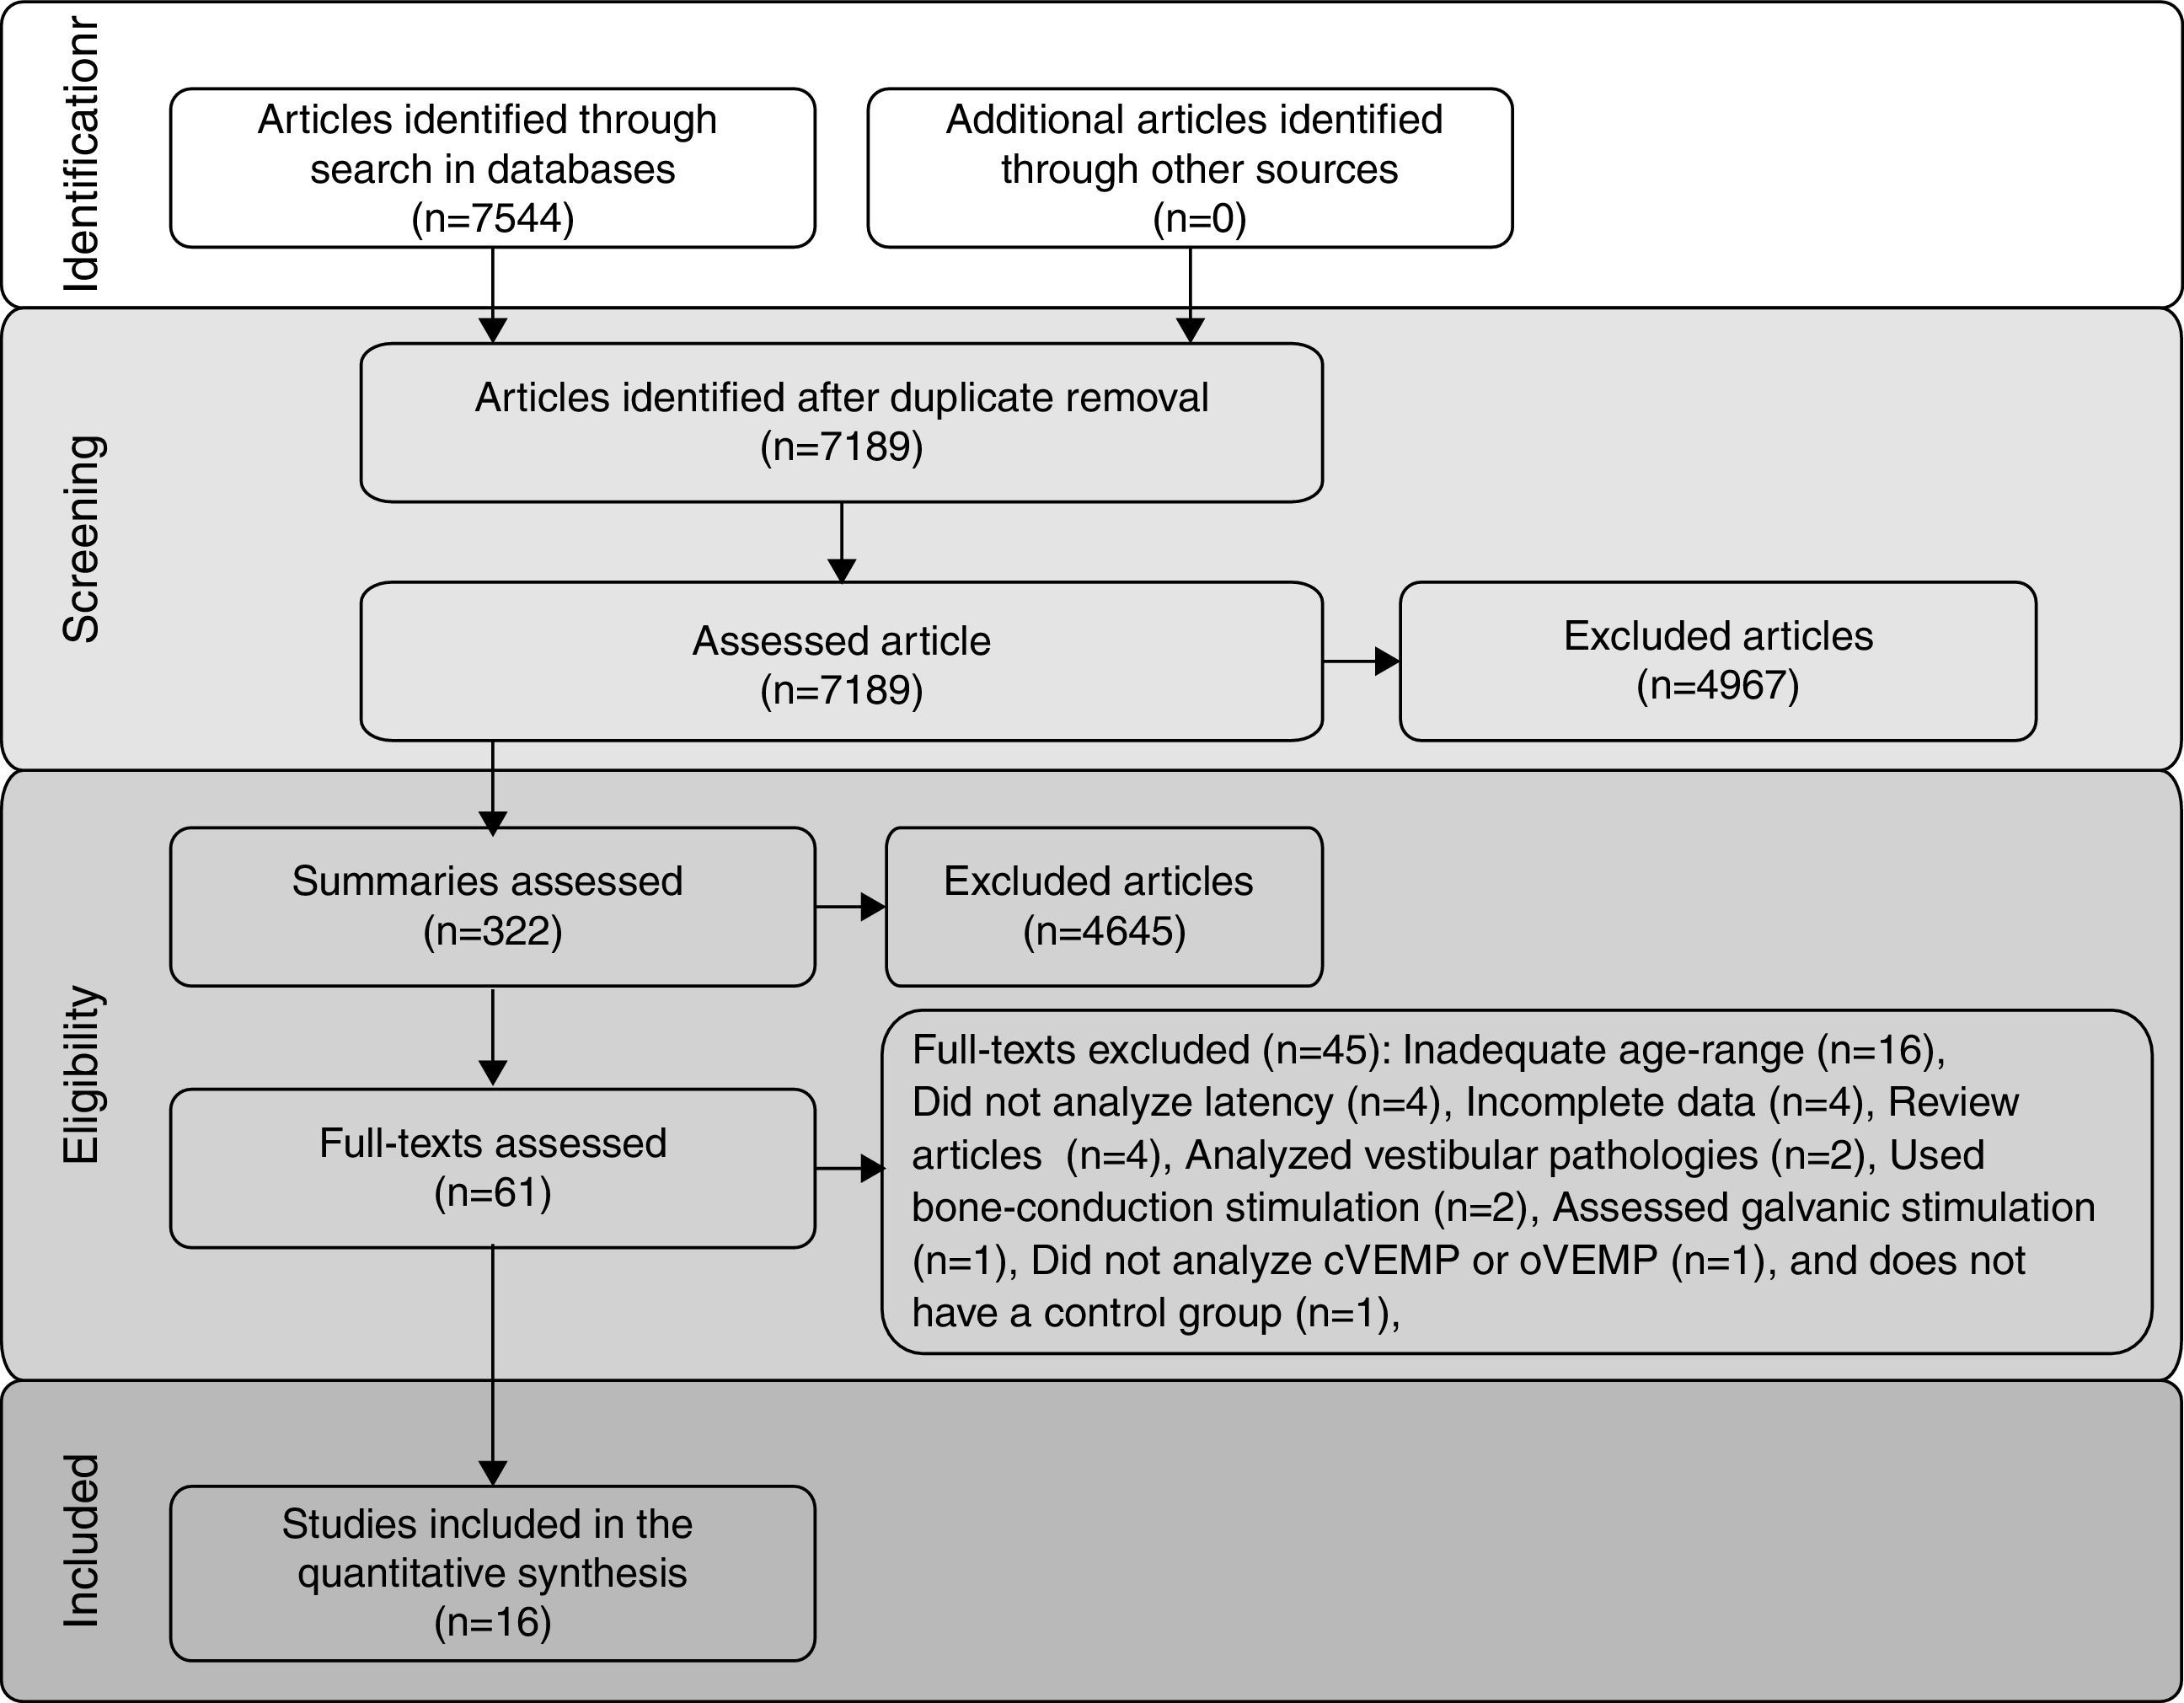
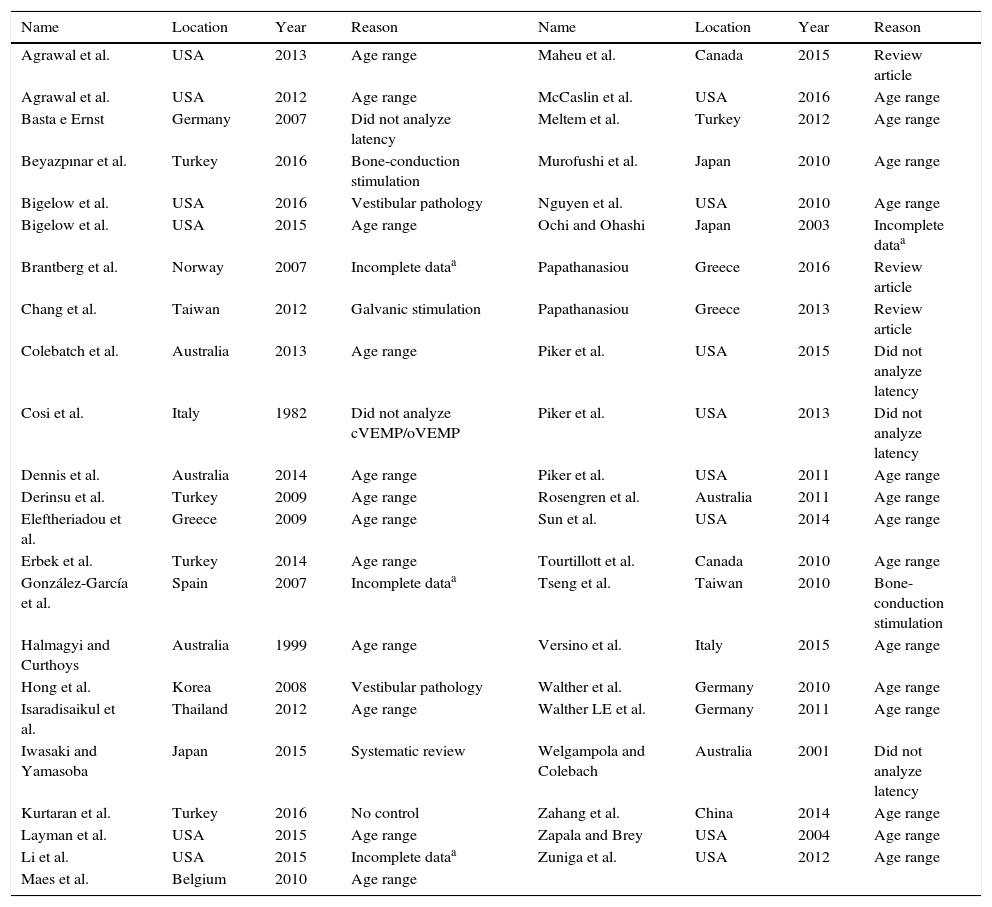
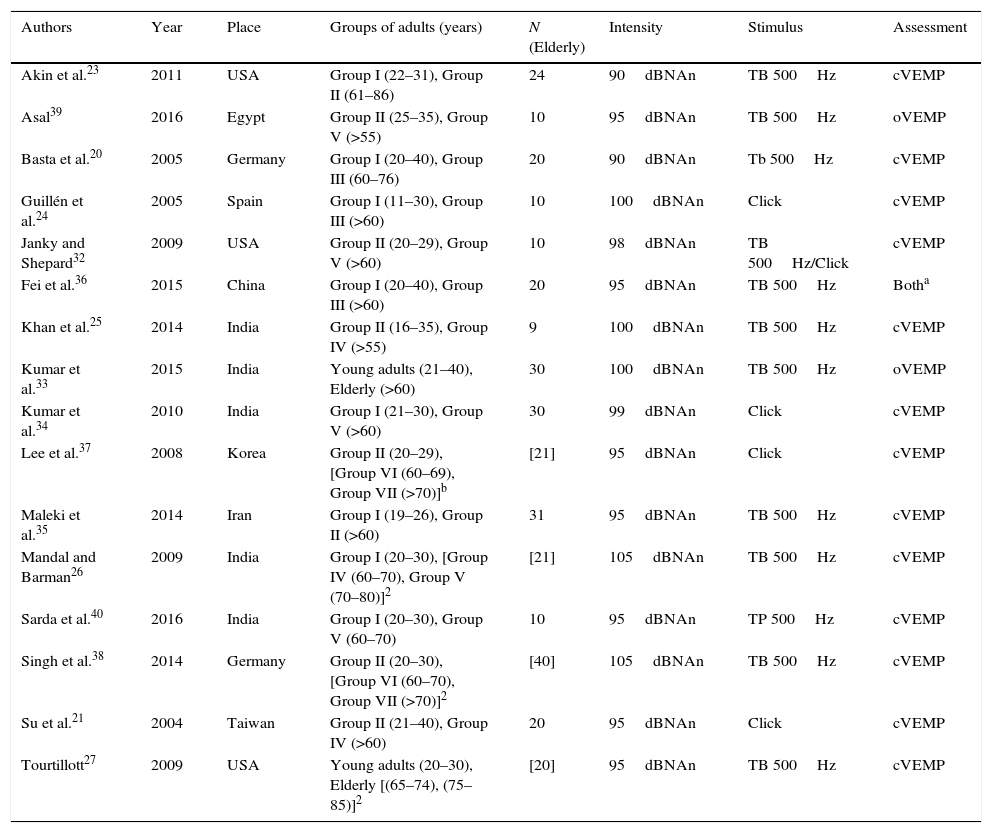
ResultsIncluded studiesThe flow diagram that illustrates study search and selection is shown in Fig. 1. Of the 7544 titles considered relevant from the searches in these databases, 322 abstracts were read and, of those, 61 full texts were selected for reading in full. After reading, 41 articles were excluded, as they did not meet the eligibility criteria and four because they did not have sufficient data and their authors did not respond to the request for additional information (Table 3). Therefore, 16 full texts were included in the qualitative and quantitative analysis (Table 4). The latency means of young adults and elderly individuals of the meta-analyzed articles are shown in Table 5 (oVEMP) and Table 6 (cVEMP).

Full texts excluded from the analysis.
| Name | Location | Year | Reason | Name | Location | Year | Reason |
|---|---|---|---|---|---|---|---|
| Agrawal et al. | USA | 2013 | Age range | Maheu et al. | Canada | 2015 | Review article |
| Agrawal et al. | USA | 2012 | Age range | McCaslin et al. | USA | 2016 | Age range |
| Basta e Ernst | Germany | 2007 | Did not analyze latency | Meltem et al. | Turkey | 2012 | Age range |
| Beyazpınar et al. | Turkey | 2016 | Bone-conduction stimulation | Murofushi et al. | Japan | 2010 | Age range |
| Bigelow et al. | USA | 2016 | Vestibular pathology | Nguyen et al. | USA | 2010 | Age range |
| Bigelow et al. | USA | 2015 | Age range | Ochi and Ohashi | Japan | 2003 | Incomplete dataa |
| Brantberg et al. | Norway | 2007 | Incomplete dataa | Papathanasiou | Greece | 2016 | Review article |
| Chang et al. | Taiwan | 2012 | Galvanic stimulation | Papathanasiou | Greece | 2013 | Review article |
| Colebatch et al. | Australia | 2013 | Age range | Piker et al. | USA | 2015 | Did not analyze latency |
| Cosi et al. | Italy | 1982 | Did not analyze cVEMP/oVEMP | Piker et al. | USA | 2013 | Did not analyze latency |
| Dennis et al. | Australia | 2014 | Age range | Piker et al. | USA | 2011 | Age range |
| Derinsu et al. | Turkey | 2009 | Age range | Rosengren et al. | Australia | 2011 | Age range |
| Eleftheriadou et al. | Greece | 2009 | Age range | Sun et al. | USA | 2014 | Age range |
| Erbek et al. | Turkey | 2014 | Age range | Tourtillott et al. | Canada | 2010 | Age range |
| González-García et al. | Spain | 2007 | Incomplete dataa | Tseng et al. | Taiwan | 2010 | Bone-conduction stimulation |
| Halmagyi and Curthoys | Australia | 1999 | Age range | Versino et al. | Italy | 2015 | Age range |
| Hong et al. | Korea | 2008 | Vestibular pathology | Walther et al. | Germany | 2010 | Age range |
| Isaradisaikul et al. | Thailand | 2012 | Age range | Walther LE et al. | Germany | 2011 | Age range |
| Iwasaki and Yamasoba | Japan | 2015 | Systematic review | Welgampola and Colebach | Australia | 2001 | Did not analyze latency |
| Kurtaran et al. | Turkey | 2016 | No control | Zahang et al. | China | 2014 | Age range |
| Layman et al. | USA | 2015 | Age range | Zapala and Brey | USA | 2004 | Age range |
| Li et al. | USA | 2015 | Incomplete dataa | Zuniga et al. | USA | 2012 | Age range |
| Maes et al. | Belgium | 2010 | Age range |
Characteristics of included studies.
| Authors | Year | Place | Groups of adults (years) | N (Elderly) | Intensity | Stimulus | Assessment |
|---|---|---|---|---|---|---|---|
| Akin et al.23 | 2011 | USA | Group I (22–31), Group II (61–86) | 24 | 90dBNAn | TB 500Hz | cVEMP |
| Asal39 | 2016 | Egypt | Group II (25–35), Group V (>55) | 10 | 95dBNAn | TB 500Hz | oVEMP |
| Basta et al.20 | 2005 | Germany | Group I (20–40), Group III (60–76) | 20 | 90dBNAn | Tb 500Hz | cVEMP |
| Guillén et al.24 | 2005 | Spain | Group I (11–30), Group III (>60) | 10 | 100dBNAn | Click | cVEMP |
| Janky and Shepard32 | 2009 | USA | Group II (20–29), Group V (>60) | 10 | 98dBNAn | TB 500Hz/Click | cVEMP |
| Fei et al.36 | 2015 | China | Group I (20–40), Group III (>60) | 20 | 95dBNAn | TB 500Hz | Botha |
| Khan et al.25 | 2014 | India | Group II (16–35), Group IV (>55) | 9 | 100dBNAn | TB 500Hz | cVEMP |
| Kumar et al.33 | 2015 | India | Young adults (21–40), Elderly (>60) | 30 | 100dBNAn | TB 500Hz | oVEMP |
| Kumar et al.34 | 2010 | India | Group I (21–30), Group V (>60) | 30 | 99dBNAn | Click | cVEMP |
| Lee et al.37 | 2008 | Korea | Group II (20–29), [Group VI (60–69), Group VII (>70)]b | [21] | 95dBNAn | Click | cVEMP |
| Maleki et al.35 | 2014 | Iran | Group I (19–26), Group II (>60) | 31 | 95dBNAn | TB 500Hz | cVEMP |
| Mandal and Barman26 | 2009 | India | Group I (20–30), [Group IV (60–70), Group V (70–80)]2 | [21] | 105dBNAn | TB 500Hz | cVEMP |
| Sarda et al.40 | 2016 | India | Group I (20–30), Group V (60–70) | 10 | 95dBNAn | TP 500Hz | cVEMP |
| Singh et al.38 | 2014 | Germany | Group II (20–30), [Group VI (60–70), Group VII (>70)]2 | [40] | 105dBNAn | TB 500Hz | cVEMP |
| Su et al.21 | 2004 | Taiwan | Group II (21–40), Group IV (>60) | 20 | 95dBNAn | Click | cVEMP |
| Tourtillott27 | 2009 | USA | Young adults (20–30), Elderly [(65–74), (75–85)]2 | [20] | 95dBNAn | TB 500Hz | cVEMP |
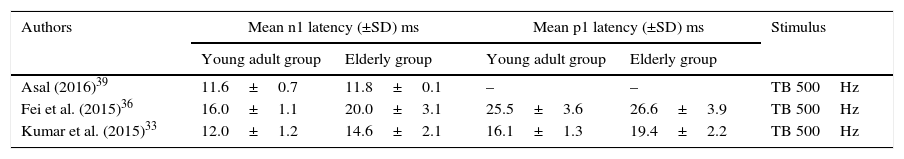
Mean and standard deviation of oVEMP n1 and p1 latencies, for young adults and for the elderly, per study.
| Authors | Mean n1 latency (±SD) ms | Mean p1 latency (±SD) ms | Stimulus | ||
|---|---|---|---|---|---|
| Young adult group | Elderly group | Young adult group | Elderly group | ||
| Asal (2016)39 | 11.6±0.7 | 11.8±0.1 | – | – | TB 500Hz |
| Fei et al. (2015)36 | 16.0±1.1 | 20.0±3.1 | 25.5±3.6 | 26.6±3.9 | TB 500Hz |
| Kumar et al. (2015)33 | 12.0±1.2 | 14.6±2.1 | 16.1±1.3 | 19.4±2.2 | TB 500Hz |
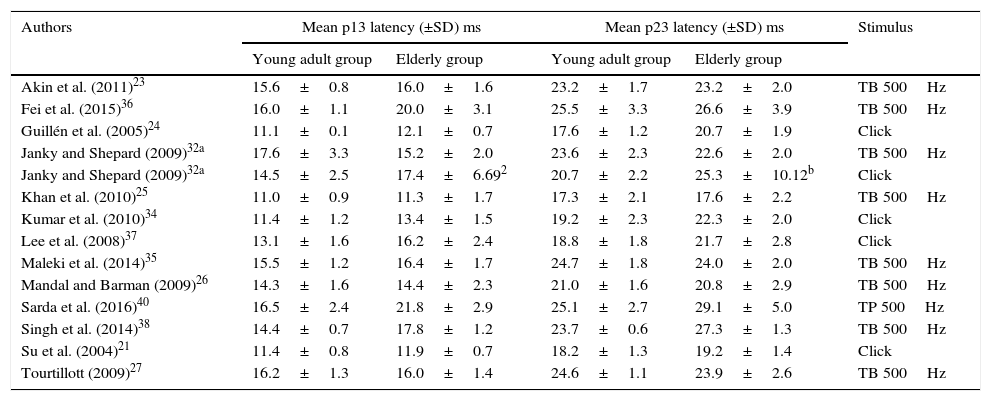
Means and standard deviations of cVEMP p13 and n23 latencies, for young adults and for the elderly, per study.
| Authors | Mean p13 latency (±SD) ms | Mean p23 latency (±SD) ms | Stimulus | ||
|---|---|---|---|---|---|
| Young adult group | Elderly group | Young adult group | Elderly group | ||
| Akin et al. (2011)23 | 15.6±0.8 | 16.0±1.6 | 23.2±1.7 | 23.2±2.0 | TB 500Hz |
| Fei et al. (2015)36 | 16.0±1.1 | 20.0±3.1 | 25.5±3.3 | 26.6±3.9 | TB 500Hz |
| Guillén et al. (2005)24 | 11.1±0.1 | 12.1±0.7 | 17.6±1.2 | 20.7±1.9 | Click |
| Janky and Shepard (2009)32a | 17.6±3.3 | 15.2±2.0 | 23.6±2.3 | 22.6±2.0 | TB 500Hz |
| Janky and Shepard (2009)32a | 14.5±2.5 | 17.4±6.692 | 20.7±2.2 | 25.3±10.12b | Click |
| Khan et al. (2010)25 | 11.0±0.9 | 11.3±1.7 | 17.3±2.1 | 17.6±2.2 | TB 500Hz |
| Kumar et al. (2010)34 | 11.4±1.2 | 13.4±1.5 | 19.2±2.3 | 22.3±2.0 | Click |
| Lee et al. (2008)37 | 13.1±1.6 | 16.2±2.4 | 18.8±1.8 | 21.7±2.8 | Click |
| Maleki et al. (2014)35 | 15.5±1.2 | 16.4±1.7 | 24.7±1.8 | 24.0±2.0 | TB 500Hz |
| Mandal and Barman (2009)26 | 14.3±1.6 | 14.4±2.3 | 21.0±1.6 | 20.8±2.9 | TB 500Hz |
| Sarda et al. (2016)40 | 16.5±2.4 | 21.8±2.9 | 25.1±2.7 | 29.1±5.0 | TP 500Hz |
| Singh et al. (2014)38 | 14.4±0.7 | 17.8±1.2 | 23.7±0.6 | 27.3±1.3 | TB 500Hz |
| Su et al. (2004)21 | 11.4±0.8 | 11.9±0.7 | 18.2±1.3 | 19.2±1.4 | Click |
| Tourtillott (2009)27 | 16.2±1.3 | 16.0±1.4 | 24.6±1.1 | 23.9±2.6 | TB 500Hz |
Among the selected studies, only three assessed oVEMP. However, one of them did not have p1 latency data and, thus, the meta-analysis of this component was very compromised. On the other hand, 13 articles had mean and standard deviation data for the cVEMP latency components, p13 and n23, for the control group and for the elderly group. Of these, four studies found a significant difference between the groups, one of them found a significant difference for p13 and non-significant for n23, three studies were not clear whether there were differences and five affirmed that there were no differences between groups.
A total of 120 subjects were studied for the assessment of n1 and p1 latencies of oVEMP, 60 of which were elderly and 60 were young adults, and 326 subjects, of which 296 elderly and 326 young adults, were evaluated for cVEMP p13 and n23 latencies.
In Table 6, all data on means and standard deviations were provided except the standard deviations of p13 and n23 latencies of the elderly of one of the studies, when evoked by Clicks. In this case, the standard deviations were calculated by applying an international convention in which the quotient: mean/2.5 is used to find the standard deviation.
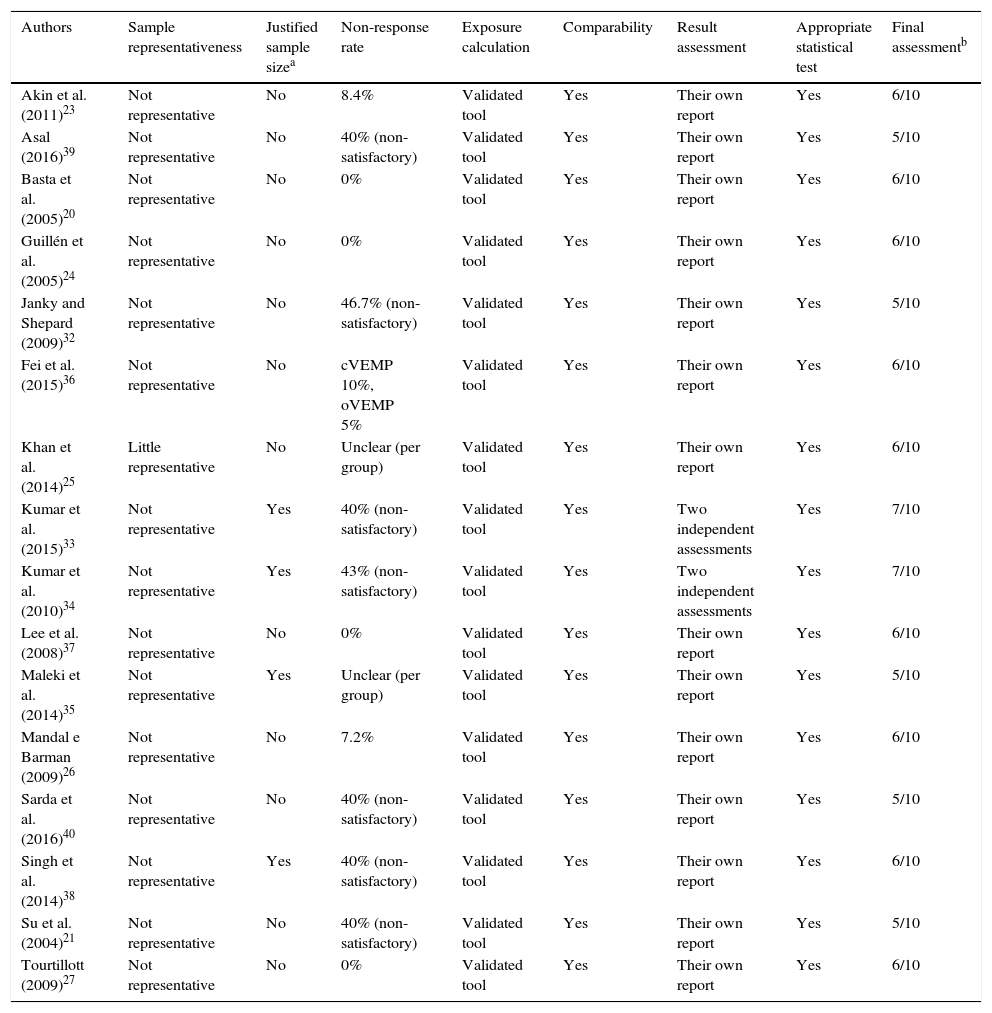
Bias risk assessmentThe analysis of the quality of the included articles and, consequently, of the risk of bias, is shown in Table 7.21,23–27,32–40 All included studies are characterized as observational and cross-sectional studies. In addition, in the final evaluation, all had a percentage of quality equal to or superior to 50% (5/10), whereas two of them obtained a maximum score of 70% (7/10).
Quality of included articles, according to the “Newcastle–Ottawa” quality assessment scale.
| Authors | Sample representativeness | Justified sample sizea | Non-response rate | Exposure calculation | Comparability | Result assessment | Appropriate statistical test | Final assessmentb |
|---|---|---|---|---|---|---|---|---|
| Akin et al. (2011)23 | Not representative | No | 8.4% | Validated tool | Yes | Their own report | Yes | 6/10 |
| Asal (2016)39 | Not representative | No | 40% (non-satisfactory) | Validated tool | Yes | Their own report | Yes | 5/10 |
| Basta et al. (2005)20 | Not representative | No | 0% | Validated tool | Yes | Their own report | Yes | 6/10 |
| Guillén et al. (2005)24 | Not representative | No | 0% | Validated tool | Yes | Their own report | Yes | 6/10 |
| Janky and Shepard (2009)32 | Not representative | No | 46.7% (non-satisfactory) | Validated tool | Yes | Their own report | Yes | 5/10 |
| Fei et al. (2015)36 | Not representative | No | cVEMP 10%, oVEMP 5% | Validated tool | Yes | Their own report | Yes | 6/10 |
| Khan et al. (2014)25 | Little representative | No | Unclear (per group) | Validated tool | Yes | Their own report | Yes | 6/10 |
| Kumar et al. (2015)33 | Not representative | Yes | 40% (non-satisfactory) | Validated tool | Yes | Two independent assessments | Yes | 7/10 |
| Kumar et al. (2010)34 | Not representative | Yes | 43% (non-satisfactory) | Validated tool | Yes | Two independent assessments | Yes | 7/10 |
| Lee et al. (2008)37 | Not representative | No | 0% | Validated tool | Yes | Their own report | Yes | 6/10 |
| Maleki et al. (2014)35 | Not representative | Yes | Unclear (per group) | Validated tool | Yes | Their own report | Yes | 5/10 |
| Mandal e Barman (2009)26 | Not representative | No | 7.2% | Validated tool | Yes | Their own report | Yes | 6/10 |
| Sarda et al. (2016)40 | Not representative | No | 40% (non-satisfactory) | Validated tool | Yes | Their own report | Yes | 5/10 |
| Singh et al. (2014)38 | Not representative | Yes | 40% (non-satisfactory) | Validated tool | Yes | Their own report | Yes | 6/10 |
| Su et al. (2004)21 | Not representative | No | 40% (non-satisfactory) | Validated tool | Yes | Their own report | Yes | 5/10 |
| Tourtillott (2009)27 | Not representative | No | 0% | Validated tool | Yes | Their own report | Yes | 6/10 |
Results shown as: points obtained/maximum score.
Only one study assessed the sample representativeness,25 as it was a normative study and analyzed all available subjects in a certain period. All other studies made choices per convenience group.
The satisfactory sample size of the elderly group was a concern of four studies,33–36 which conform to the central limit theorem, with samples larger than 30 subjects. However, none of them performed calculations to estimate the size of their samples.
The non-response rate was satisfactory in 50% of all studies using validated tools for data collection and the comparability between the control group and the elderly group was also possible for all of them. The evaluation of the results was carried out in all the studies through their own reports, except in the two studies,33,34 in which wave analysis was carried out by two independent professionals. Finally, all studies used appropriate statistical tests.
Data analysisAs the studies are not randomized, the groups showed great discrepancy as early as in the first evaluation. Thus, to avoid the phenomenon of regression to the mean, it was necessary to analyze the variations between the final and initial latency values, as well as the standard deviation associated to these variations.
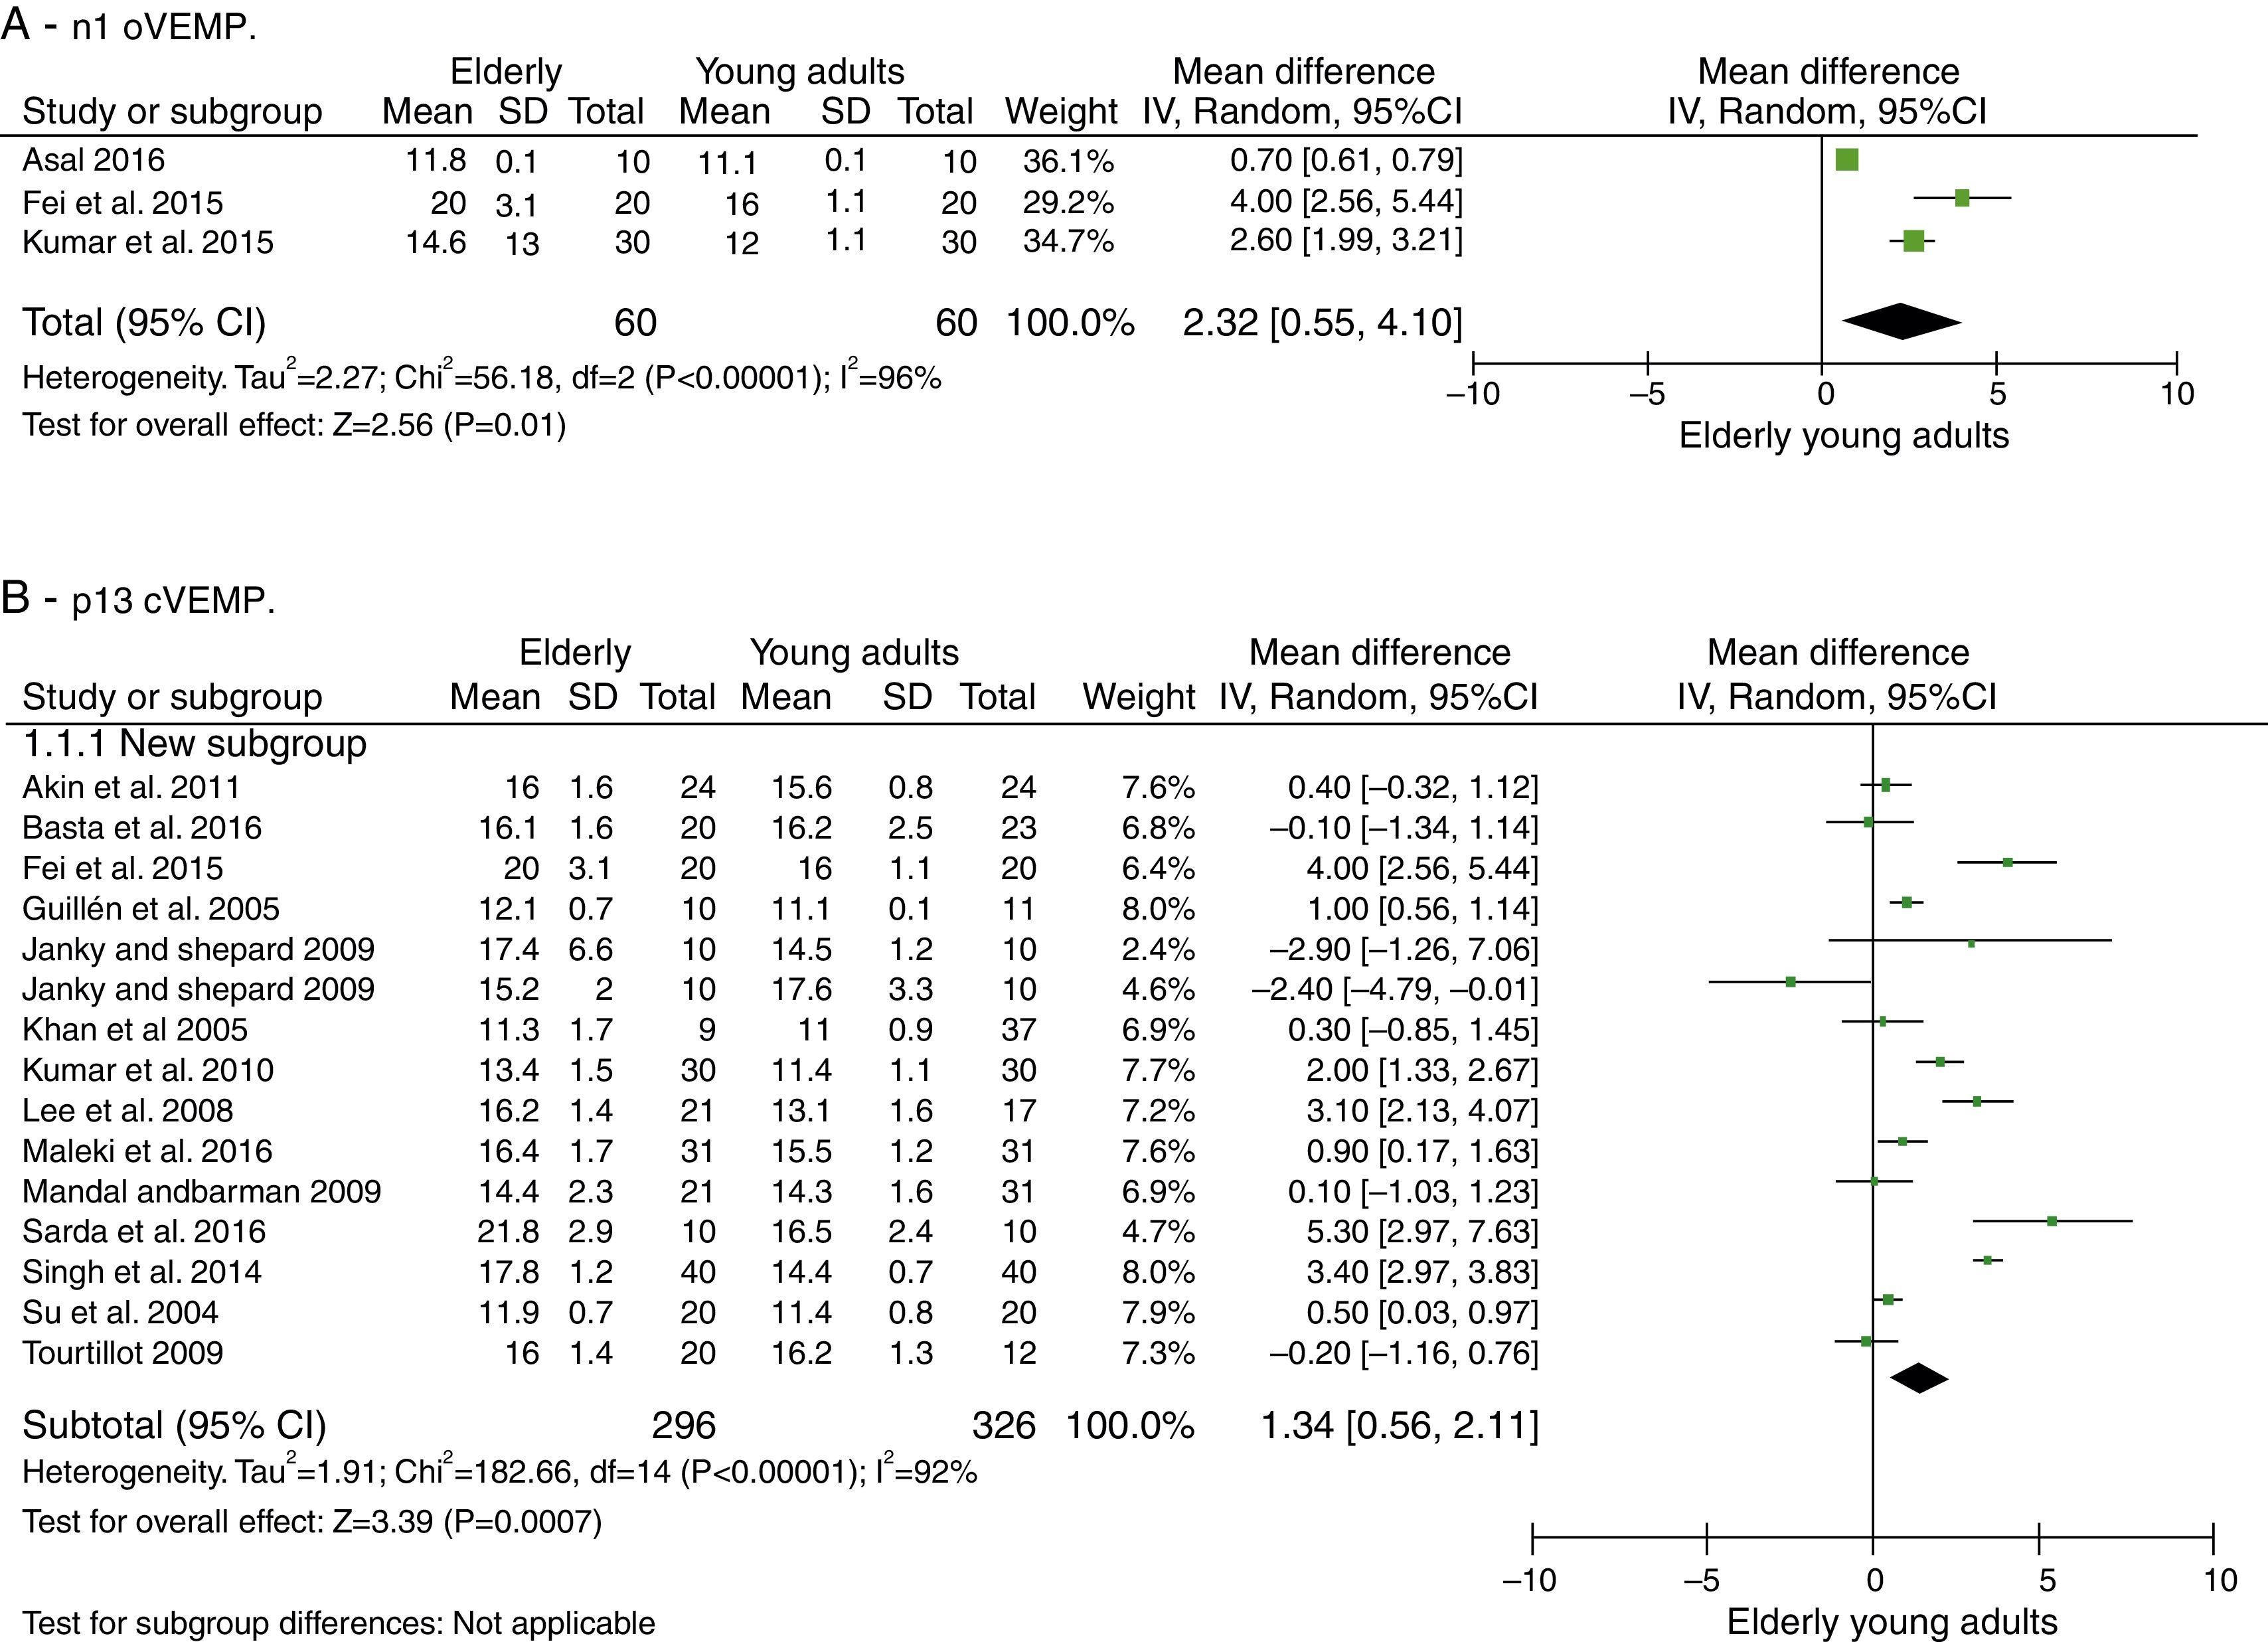
oVEMP: n1 and p1 latenciesThe number of articles to be meta-analyzed for oVEMP n1 latencies was small, as there were only three of them.33,37,38 The mean delay of this component for the latencies of the elderly was 2.32ms with 95% CI of 0.55–4.10ms. The overall effect test showed p=0.01; disclosing that such difference was significant. However, the heterogeneity I2=96%, with a p value <0.001 (Fig. 2A). Finally, due to the small number of selected studies, it was not possible to analyze the subgroups to understand the origins of this heterogeneity.
 n1 oVEMP. (B) p13 cVEMP. * The study by Janky and Shepard 2009 appears twice, as it was carried out two different tests, one with click and another with TB.")
On the other hand, only two articles were found for the p1 component,37,38 which considerably affected the analyses, as previously described, and made its study impossible.
cVEMP: p13 and n23 latenciesThe number of articles to be meta-analyzed for cVEMP components p13 and n23 latencies was quite encouraging. Thus, 13 were selected (described in Table 7).
For the p13 component, the mean delay for the latencies in the elderly was 1.34ms with 95% CI of 0.56–2.11ms. The overall effect test showed p<0.001; disclosing that such a difference was significant. However, a heterogeneity value of I2=92% was found, with p<0.001 (Fig. 2B).
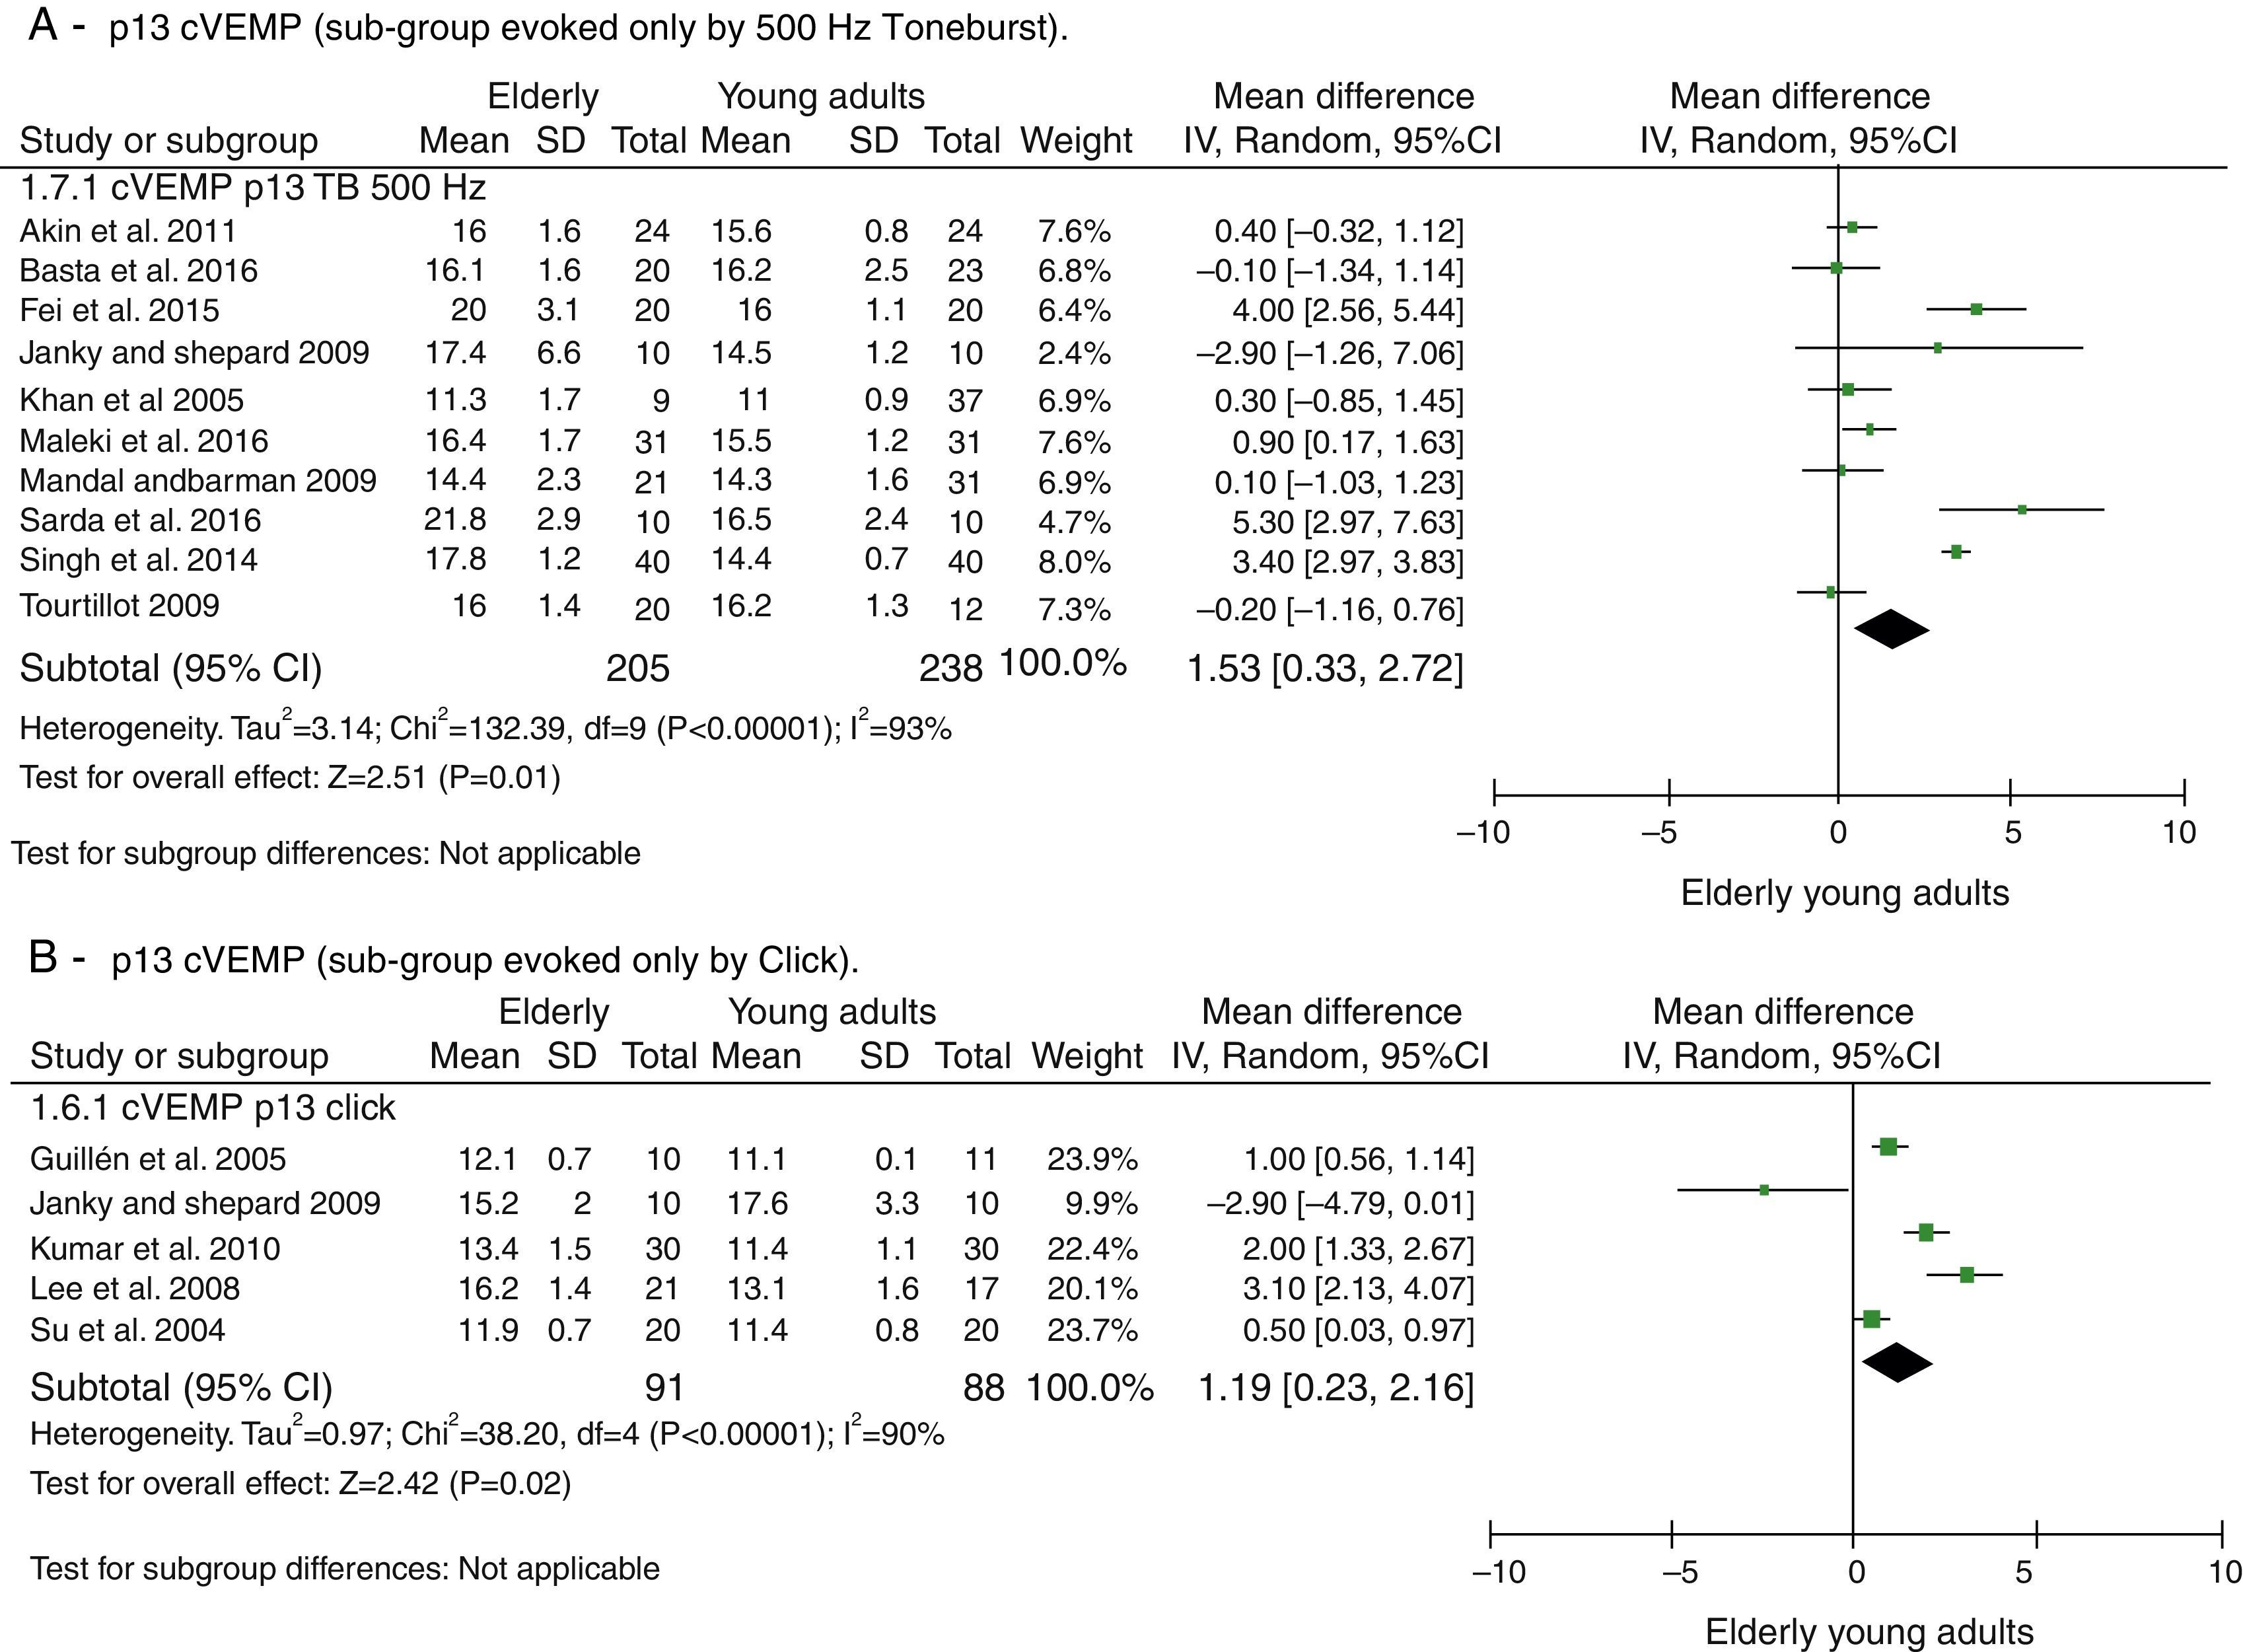
The attempts to analyze the subgroups were not successful in explaining heterogeneity. When dividing the groups by used stimuli to evoke cVEMP, Toneburst or Click, in both cases, it remained high and with p<0.001, as can be seen in Fig. 3. The same was done for the stimulus intensity (up to 95dBNAn and >95dBNAn) and for the age ranges of the control groups (20–30 years and different <20–30 years), yet both evaluations were unsuccessful.
 p13 cVEMP (sub-group evoked only by 500Hz Toneburst). (B) p13 cVEMP (sub-group evoked only by Click).")
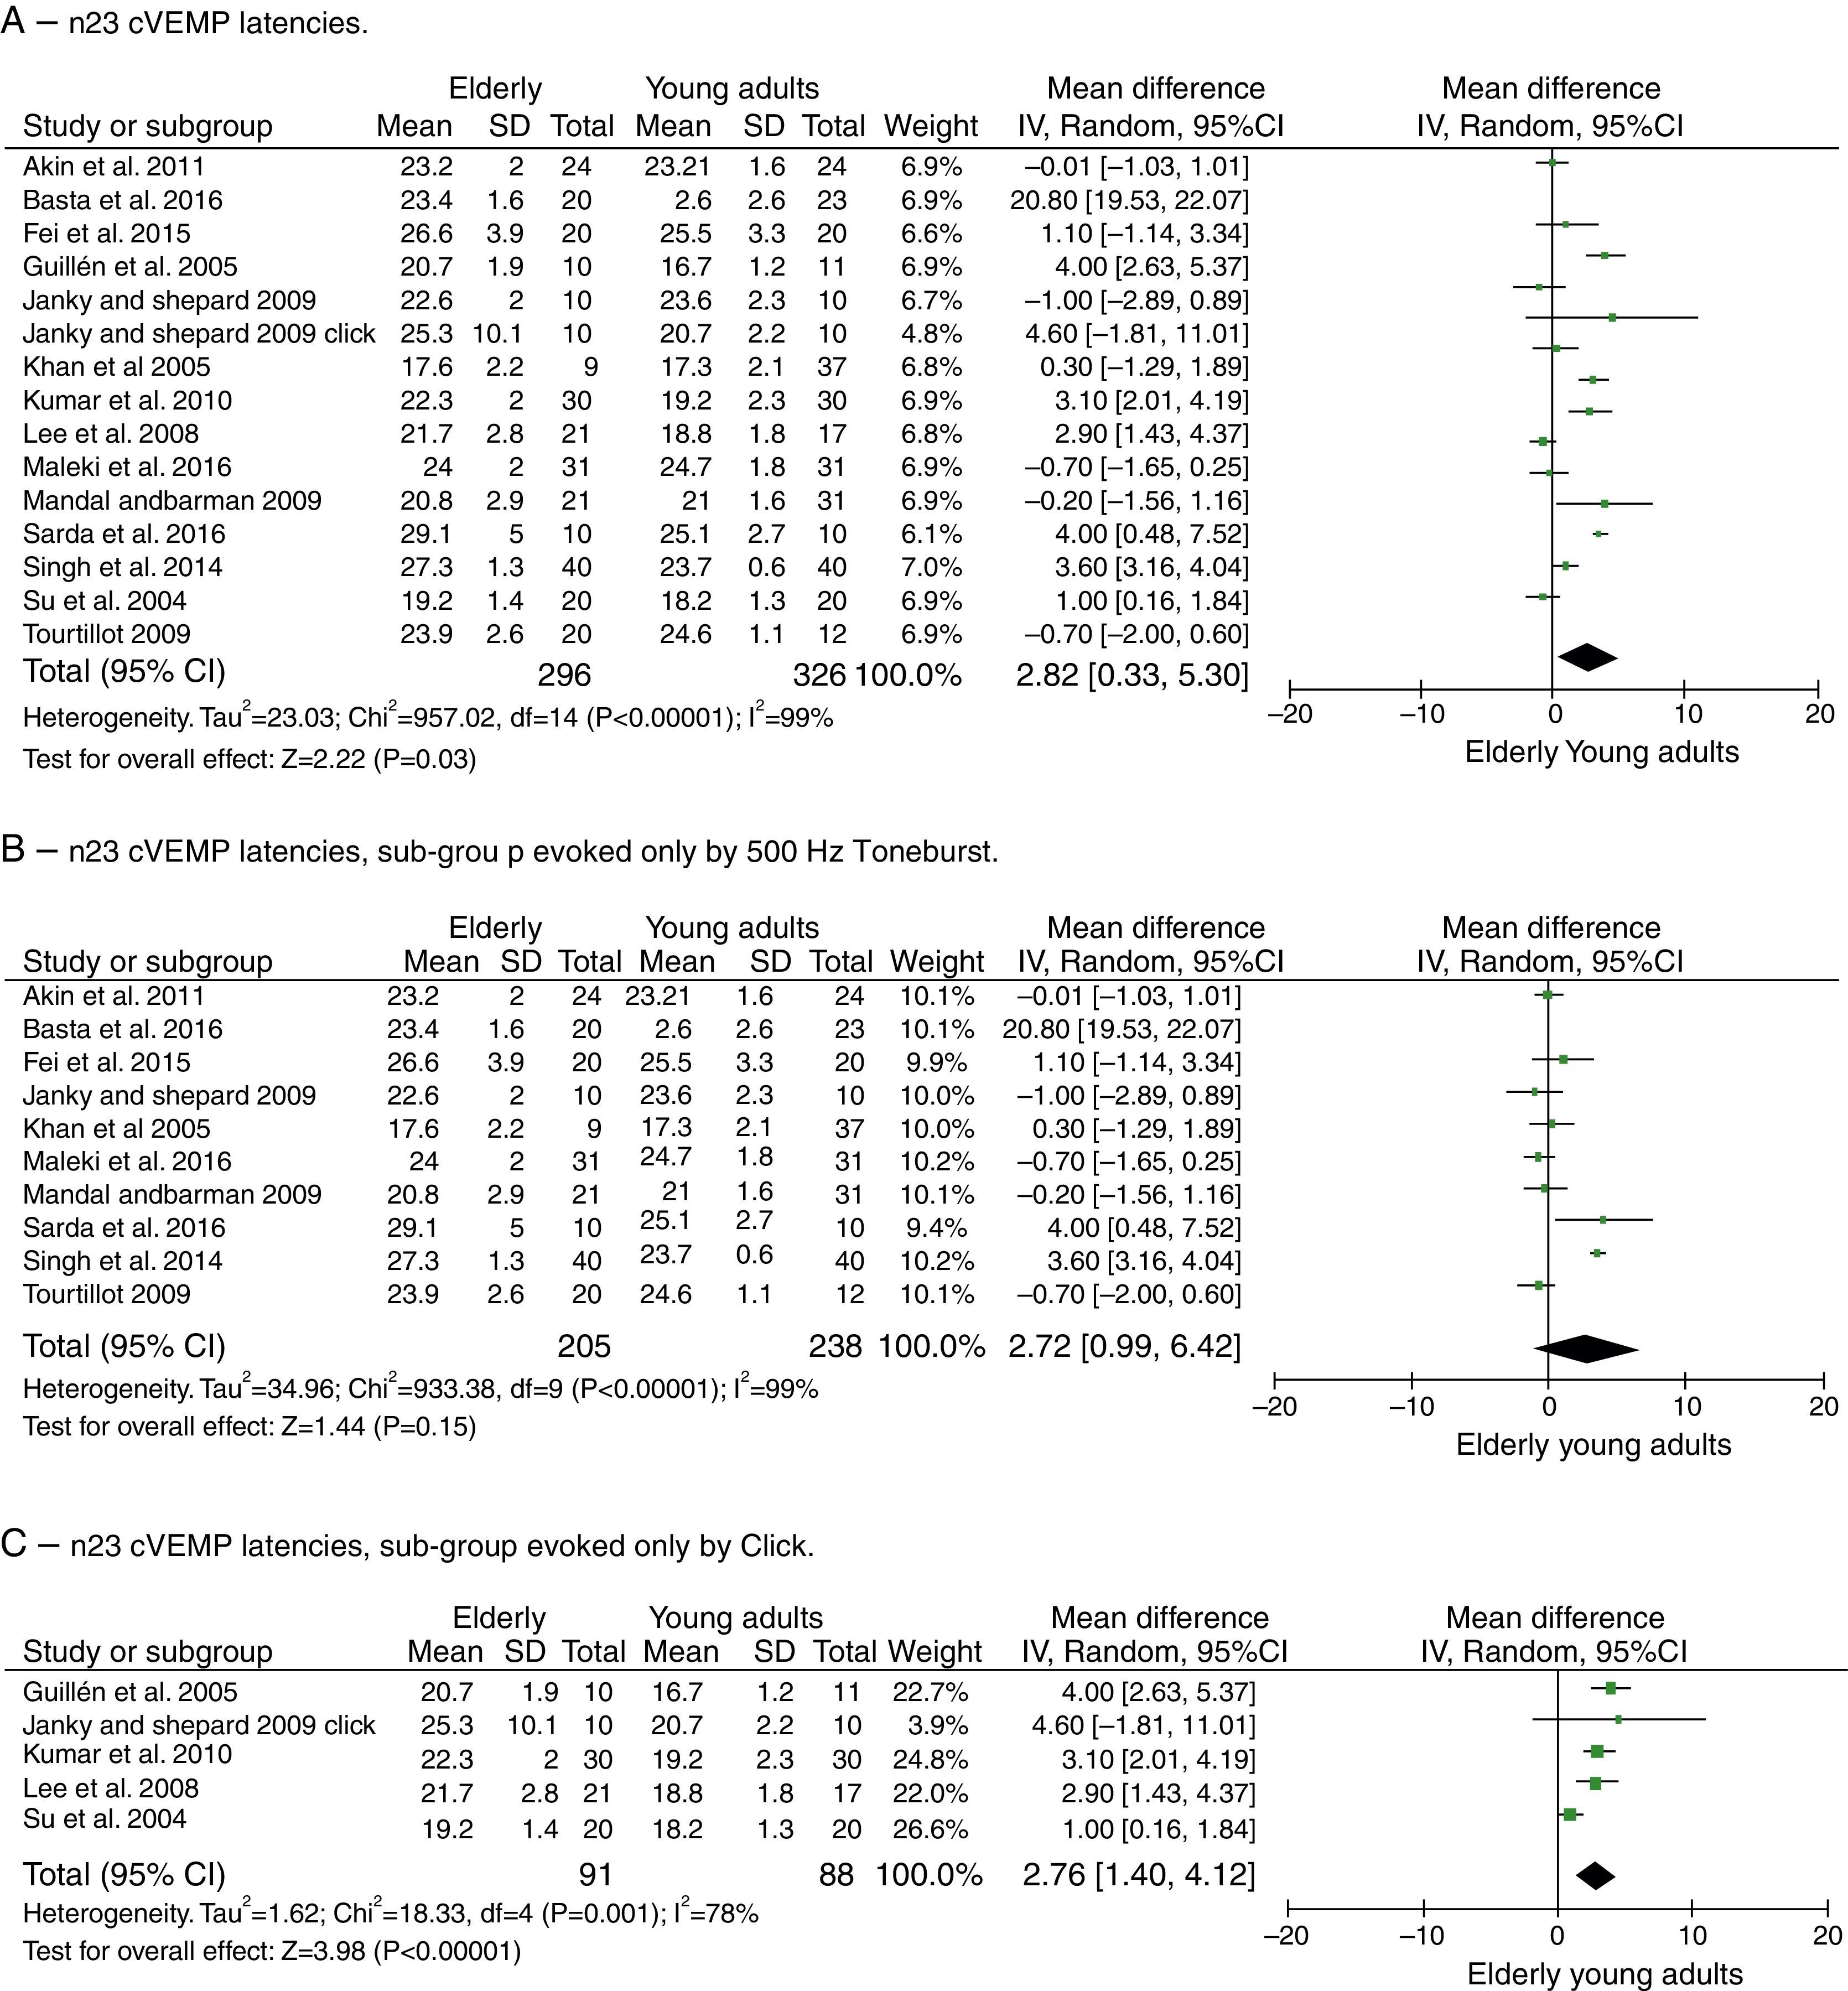
For component n23, the mean delay for the latencies in the elderly was 2.82ms with 95% CI of 0.33–5.30ms. The test for the overall effect showed a p=0.03; disclosing that the difference was significant. However, a high heterogeneity value of I2=99% was found, with p<0.001 (Fig. 4A).
 n23 cVEMP latencies. (B) n23 cVEMP latencies, sub-group evoked only by 500Hz Toneburst. (C) n23 cVEMP latencies, sub-group evoked only by Click.")
Meta-analysis: comparison of n23cVEMP latencies, n23 cVEMP sub-group evoked only by 500Hz Toneburst and n23 cVEMP sub-group evoked only by Click. (A) n23 cVEMP latencies. (B) n23 cVEMP latencies, sub-group evoked only by 500Hz Toneburst. (C) n23 cVEMP latencies, sub-group evoked only by Click.
Due to the recent increase in the number of studies in the area of vestibular evoked myogenic potentials, this review highlight studies published between the years 2004 and 2016. The VEMPs were studied since the 1960s, but several centers only started to use it to evaluate the sacculo-colic reflex in the 1990s.21 Studies published at that time mostly reported on the methods used and studies in guinea pigs. From the year 2000 articles started to be published about the clinical applications, studies that involved pathologies aiming to assess the effectiveness of vestibular evoked myogenic potentials.21
Regarding the test protocols, the articles studied used strong intensity stimuli, ranging from 90 to 105dBNAn; however, only two studies used the lowest intensity.20,23 Most chose to evoke VEMP with Toneburst stimuli, corroborating the literature that recommends the use of Toneburst, because the threshold of saccular excitability is smaller when compared to the click, being more comfortable for the assessed subject, in addition to having a better definition of waves and greater response amplitude.23–27 Regarding the test frequency, the one most often used was 500Hz, as it is the most often used clinically and has a more homogeneous and constant response.
The methodological quality of the studies was satisfactory, attaining at least 50% of the maximum score. The fact that only one study25 did not use convenience sampling is a fact of concern and very common in scientific studies, as they do not allow the creation of representative samples. On the other hand, all studies used validated tools for data collection and appropriate statistical tests,20,21,23–27,32–40 which shows a greater concern with the quality of their quantitative analyses. A simple methodological adjustment can be observed in the studies, such as those performed in two articles32,33 with wave analysis by two independent researchers, which helped them to increase the quality to the maximum found in the present systematic review.
According to the findings, the nV latency component of oVEMP and the p13 and n23 components of cVEMP were more delayed in the elderly than in young adults, as reported by all selected oVEMP studies33,37,38 and in five cVEMP studies,34,36,38–40 showing that it may be associated with the reduction in the number of neurons with advancing age, especially for subjects older than 60 years. In addition, advanced age and its association with the changes in the latency of the studied component due to aforementioned loss of neurons would have significant implications in the vestibular nucleus, which could be associated with balance deterioration in the elderly. Finally, it is quite reasonable to affirm, based on the results of the other components studied and if there were sufficient articles, that the p1 wave component of oVEMP will most likely also be delayed in the elderly.33,37,38
ConclusionThe latency of oVEMP n1 wave component and the latencies of cVEMP p13 and n23 wave components are longer in the elderly aged 60 years or older than in young adults.
Conflicts of interestThe authors declare no conflicts of interest.
Please cite this article as: Macambira YK, Carnaúba AT, Fernandes LC, Bueno NB, Menezes PL. Aging and wave-component latency delays in oVEMP and cVEMP: a systematic review with meta-analysis. Braz J Otorhinolaryngol. 2017;83:475–87.
Peer Review under the responsibility of Associação Brasileira de Otorrinolaringologia e Cirurgia Cérvico-Facial.
gology is pleased to honor the reviewers


