

Perceptual evaluation is considered the gold standard to evaluate speech nasality. Several procedures are used to collect and analyze perceptual data, which makes it susceptible to errors. Therefore, there has been an increasing desire to find methods that can improve the assessment.
ObjectiveTo describe and compare the results of speech nasality obtained by assessments of live speech, the Test of Hypernasality (THYPER), assessments of audio recorded speech, and nasometry.
MethodsA retrospective study consisting of 331 patients with operated unilateral cleft lip and palate. Speech nasality was assessed by four methods of assessment: live perceptual judgement, THYPER, audio-recorded speech sample judgement by multiple judges, and nasometry. All data were collected from medical records of patients, with the exception of the speech sample recording assessment, which was carried out by multiple judges.
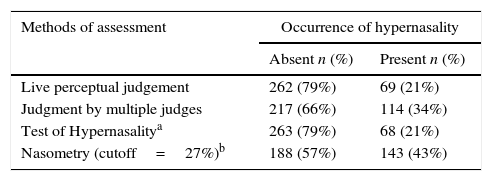
ResultsThe results showed that the highest percentages of absence of hypernasality were obtained from judgements performed live and from the THYPER, with equal results between them (79%). Lower percentages were obtained from the recordings by judges (66%) and from nasometry (57%).
ConclusionThe best results among the four speech nasality evaluation methods were obtained for the ones performed live (live nasality judgement by a speech pathologist and THYPER).
A avaliação perceptiva é considerada padrão-ouro para avaliar a nasalidade de fala. Vários procedimentos são utilizados para coletar e analisar os dados percebidos, o que a torna suscetível a erros. Por isso, há uma preocupação crescente na procura de métodos que possam aperfeiçoá-la.
ObjetivoDescrever e comparar os resultados da nasalidade de fala obtidos por meio de julgamento ao vivo, Teste de Hipernasalidade (THIPER), julgamento de gravações por juízes e nasometria.
MétodoEstudo retrospectivo de 331 pacientes com fissura labiopalatina unilateral operada. Foi realizada a análise dos resultados do julgamento da nasalidade ao vivo e por meio de gravações por juízes, do THIPER e da nasometria. Os dados foram coletados do prontuário dos pacientes, com exceção do julgamento das gravações das amostras de fala, que foi realizado por juízes múltiplos.
ResultadosForam obtidas porcentagens mais altas de ausência de hipernasalidade no julgamento ao vivo e no THIPER, com resultados iguais entre ambas (79%). Porcentagens menores de ausência de hipernasalidade foram obtidas no julgamento das gravações por juízes (66%) e para a nasometria (57%).
ConclusãoOs melhores resultados entre as quatro modalidades de avaliação da nasalidade de fala foram obtidos para as realizadas ao vivo (julgamento por um fonoaudiólogo e THIPER).
One of the great challenges for a child born with cleft lip and palate is to develop the resonance and articulation for normal speech production. A cleft palate is the most common cause of velopharyngeal dysfunction (VPD), and primary palatoplasty should aim to establish the anatomical and functional conditions for proper closure of the velopharyngeal mechanism during speech.1,2 In general, speech disorders related to VPD are hypernasality, air emission and compensatory articulation.3
The diagnosis of speech disorders resulting from VPD should be carried out through clinical and instrumental assessment. The auditory-perceptual assessment is considered the gold standard to assess speech disorders related to VPD and cleft palate. It is the method that allows the identification of these alterations, the assessment of their severity as well as the evaluation of the effectiveness of performed treatments.4,5 However, several procedures are used to collect and analyze data of the perceptual assessment, making it difficult to compare different studies,1,6 in addition to the fact that this assessment is subjective.7 As the auditory-perceptual assessment is susceptible to errors due to its subjectivity, there has been an increasing desire to seek methods that could improve this evaluation.
For instance, the instrumental acoustic analysis of the speech signal, such as the nasometry, was developed as a means of corroborating the perceptual tests of speech resonance. The nasometer provides the degree of “nasalance”, which is the average ratio of nasal/total (nasal plus oral) acoustic energy converted to a percentage value.8 The nasalance value reflects the relative amount of nasal acoustic energy in an individual's speech. The validity of the nasometer to measure hypernasality has been demonstrated by many researchers,9,10 resulting in acceptance and use of nasometry in both clinical and research settings.11,12 However, some variables may hinder the judgment of nasality and interfere with the obtained results.
This study aimed to describe and compare the speech nasality results among four assessment modalities: (1) the auditory-perceptual judgment performed live; (2) the auditory-perceptual judgment based on recordings; (3) Test of Hypernasality (THYPER); and (4) nasometry.
MethodsThis was a retrospective study that used data from three types of auditory-perceptual assessment: judgment of nasality performed live and by judges, THYPER and nasometry of 331 patients (132 girls and 199 boys) with operated unilateral cleft lip and palate, submitted to these three evaluations between 5 and 13 years of age. The study was approved by the Ethics Committee in Research with Human Beings on 25 March 2014 (Opinion number 569,720).
The data were collected according to the following inclusion criteria: (a) the selected judgement of nasality performed live, THYPER and nasometry had to be performed during the patient's same visit to the institution and had to be available in each patient's medical record; (b) the selected speech recordings should also have been performed on the patient's same visit to the institution when he or she was submitted to the judgement of nasality performed live and to nasometry. Only those assessments containing the following five sentences with low pressure consonants were selected: O louro ia olhar a lua (The parrot was going to see the moon), Laura lia ao luar (Laura read by the moonlight), A leoa é leal (The lioness is loyal), Lili era loira (Lili was blond), Lulu olha a arara (Lulu looks the macaw).
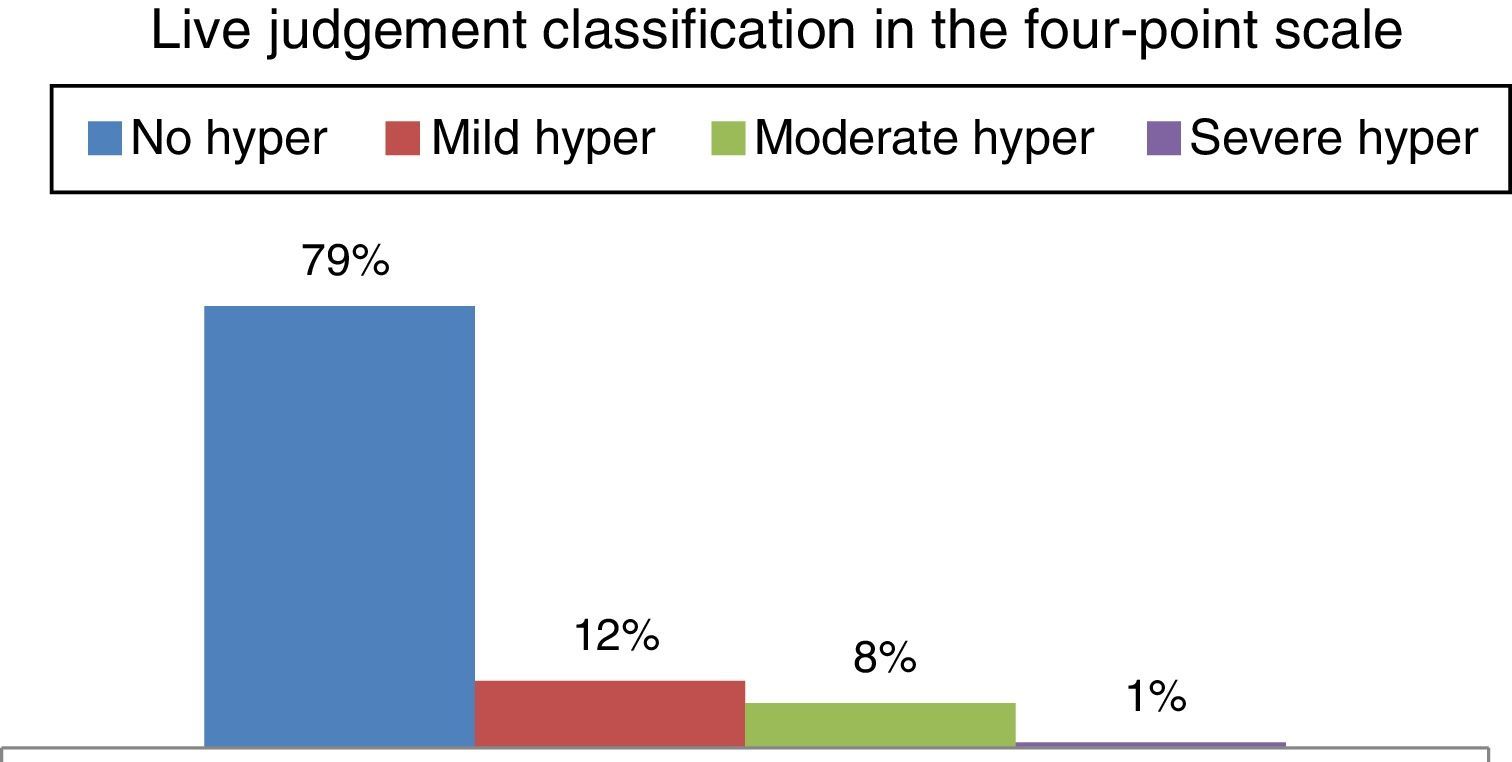
Auditory-perceptual assessment of speech nasality performed liveThis judgment was carried out by an experienced speech/language pathologist during spontaneous speech and repetition of words and phrases by the patients, using a four-point scale (0=no hypernasality, 1=mild hypernasality, 2=moderate hypernasality and 3=severe hypernasality).
Test of Hypernasality (THYPER)This test involves the repetition of 10 two-syllable words, composed only by the consonant [b] and oral vowels (babá, bebê, bibi, bobó, bubu, baba, bebe, bobi, boba, buba), each repeated twice, one performed in the usual manner with open nostrils and another with occluded nostrils. The rationale for the test interpretation is the assumption that if the patient has velopharyngeal closure during word utterance, there is no perceptual change in resonance with or without nostril occlusion. However, if the patient does not have velopharyngeal closure, the sound produced will be directed to the nasal cavity, causing hypernasality. In this case there will be noticeable change in the production of the same word when comparing utterance with and without nostril occlusion.
The final test score considers the number of words for which the evaluator heard the noticeable change in resonance. Scores may range from 0 to 10, indicating that there was no variation in the resonance of any of the pairs of the 10 words, to 10–10, indicating resonance variation in all pairs (Fig. 1).
Auditory-perceptual assessment of speech nasality through recordings
Speech samples were read or repeated after the evaluator and recorded on audio simultaneously to nasometry. The recordings were made in a silent, sound-treated environment, using an AKG C420 headset microphone, positioned 5cm from the mouth, and an Intel Pentium 4 computer (256MB 15RAM), consisting of a Creative Audigy II sound card and using Sony Sound Forge program (2003), with a sampling rate of 44,100Hz, in a single channel, 16 bits. The selected recordings were edited using the Sony Sound Forge Pro 10.0 software and recorded into a CD.
To test the intrajudge reliability, 50 (15%) samples were duplicated and inserted randomly into a file containing a total of 381 sentences (331+50). The samples were judged by three speech/language pathologists (judges) with more than 10 years of experience in the diagnosis and treatment of VPD and cleft lip and palate. Before the judgement, the judges went through a training session so they could become familiarized with the procedure and scale use. The recordings were heard using the Windows Media Player program (Microsoft Windows) and headphones.
The judges were seated in a quiet room and completed tasks presented with Windows Media Player (Microsoft Windows) over headphones (AKG K414P) connected to a stereo splitter. They should judge the recorded samples until a consensus was reached.
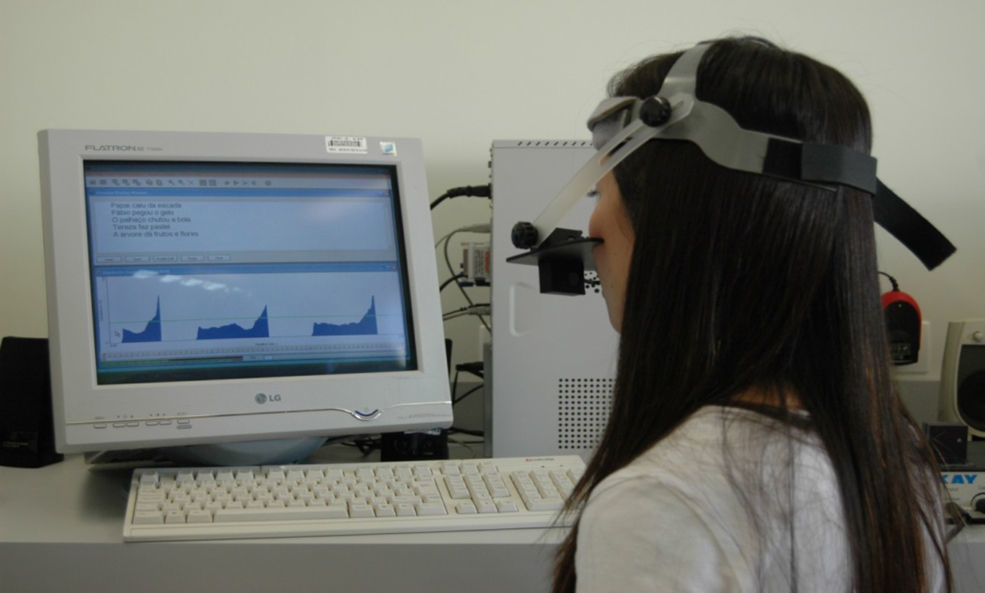
Nasometric assessmentThis assessment was performed by experienced speech/language pathologists, using a 6200-2 Pentium Byte On nasometer, manufactured by KayElemetrics (1992). The equipment consists of a microcomputer-based system, in which the acoustic, oral and nasal speech energy is picked up by two microphones directed to the individual's mouth and nose, separated by a horizontal metal plate positioned above the upper lip during the speech sample recording. The set is held in position by a helmet (Fig. 2).

The signal of each microphone is filtered and digitalized by electronic modules and processed using specific software, which calculates nasalance. The nasalance measurements were obtained after the repetition of the same low pressure phrases described above.
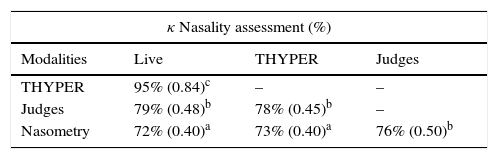
Data analysisIntrajudge agreement of the recorded samples was calculated using kappa statistics.13 To obtain the indices of sensitivity, specificity and overall nasometer efficiency, the cut-off value of 27% was used. The agreement percentages of the four types of assessment were presented in pairs, by combining two methods, using kappa statistics. The comparison between the results of the four modalities regarding the absence and presence of hypernasality was carried out in pairs, using the McNemar test, with a significance level of p<0.05.
ResultsThe results regarding the occurrence of hypernasality in the four modalities of assessment are shown in Table 1.
Distribution of the number and percentage of patients according to the occurrence of hypernasality in the four types of assessment.
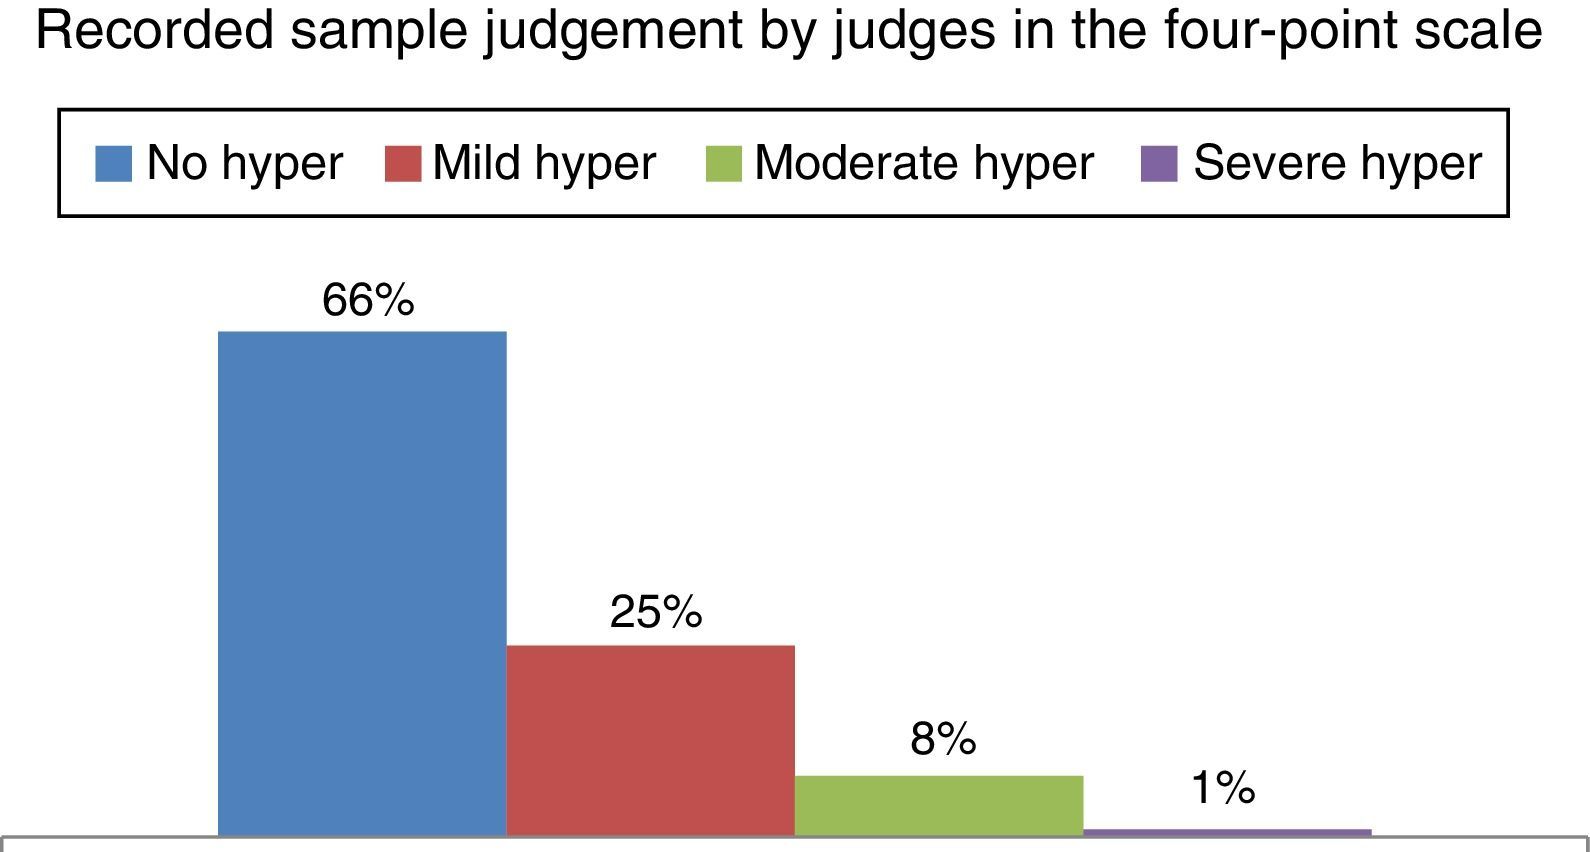
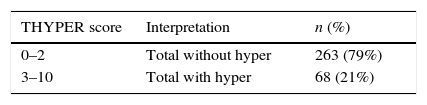
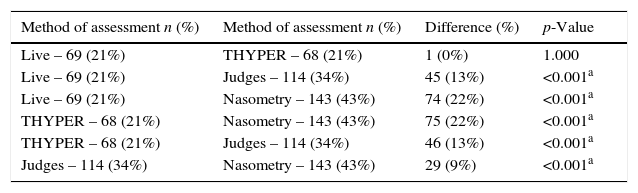
The results of the nasality judgment performed live are shown in Fig. 3; the results of THYPER score interpretation are shown in Table 2; the auditory-perceptual judgment of speech nasality by judges is shown in Fig. 4; the percentage of agreement level (κ) between the four types of assessment are described in Table 3; the comparison of the four evaluation methods is shown in Table 4 (compared in six pairs: live vs. THYPER; live vs. judges; live vs. nasometry; judges vs. nasometry; judges vs. THYPER; THYPER vs. nasometry).

Distribution of THYPER scores with binary interpretation of the findings and calculation of the percentage indicating absence (without hypernasality) and presence (with hypernasality).
| THYPER score | Interpretation | n (%) |
|---|---|---|
| 0–2 | Total without hyper | 263 (79%) |
| 3–10 | Total with hyper | 68 (21%) |
Scores (0–2), without hypernasality; scores (3 or >), with hypernasality.

Number and percentage of patients with hypernasality, according to the four methods of assessment and difference between findings and p value.
| Method of assessment n (%) | Method of assessment n (%) | Difference (%) | p-Value |
|---|---|---|---|
| Live – 69 (21%) | THYPER – 68 (21%) | 1 (0%) | 1.000 |
| Live – 69 (21%) | Judges – 114 (34%) | 45 (13%) | <0.001a |
| Live – 69 (21%) | Nasometry – 143 (43%) | 74 (22%) | <0.001a |
| THYPER – 68 (21%) | Nasometry – 143 (43%) | 75 (22%) | <0.001a |
| THYPER – 68 (21%) | Judges – 114 (34%) | 46 (13%) | <0.001a |
| Judges – 114 (34%) | Nasometry – 143 (43%) | 29 (9%) | <0.001a |
The results of sensitivity, specificity and overall nasometer efficiency indices were 62%, 87% and 76%, respectively.
DiscussionThe results showed that the highest percentages of hypernasality absence in the four modalities were obtained in the live judgement and THYPER, with equal results for both (79%). Lower percentages of hypernasality absence were obtained in judgement of recordings by judges (66%) and even lower results were obtained in nasometry (57%). Padilha14 found 69% of hypernasality absence at the live judgement, 72% in THYPER, 62% in the judgement by judges and 58% in nasometry.
Both in this study and in the study by Padilha,14 the results showed high level of agreement between the live judgement and THYPER, contrary to the agreement between the other methods of assessment, which was regular or moderate. In the present study, this same paired comparison showed a significant difference, indicating that a larger number of patients was identified to have hypernasality by the nasometry than through the judgement by judges.
The same occurred when the findings of the live judgement and THYPER were compared to results from the judgement by judges and nasometry, with the number of patients identified with hypernasality being always lower at the live judgement and THYPER. It was also observed that the live judgement by a single evaluator using the four-point scale and the THYPER scores had similar results, but significantly differ from the other studied nasality assessment modalities.
Several factors may explain the findings of this study, such as the stimulus used to obtain the speech samples, the evaluator's and the judges’ experience and training, in addition to the speech variables such as compensatory articulation, nasal snort, dysphonia, among others. Lohmander et al.15 claim that the perceptual judgment of nasality is not an easy task and report that the variables related to the speech material, the individual characteristics of the evaluators and their time of clinical experience, as well as the quality of recordings, for instance, are the factors that most interfere with result reliability.
Henningsson et al.1 affirm that speech samples must consist of sentences containing pressure consonants and all kinds of vowels, including high vowels. Kuehn and Moon16 and Sweeney and Sell10 report that hypernasality is more likely to occur in the production of high vowels, due to the need for greater effort in the velopharyngeal closure, and that speech samples devoid of nasal consonants are not representative of spontaneous speech, representing only a partial sample of hypernasality.
The quality of the evaluator selected to carry out the nasality judgment, both live and through recordings, is a factor that deserves to be discussed. The evaluator's experience in the diagnosis and evaluation of VPD facilitates the performance of the perceptual judgment, which increases the study's reliability and credibility.1,4,5,17 However, one must consider that even experienced evaluators are subject to internal (lapses of memory and attention, sleep, fatigue) and external variables (related to the environment or to the sample itself), which may interfere with judgment.18
Eadie and Baylor19 suggest a theoretical model of voice quality perception, emphasizing that it is common for listeners, when judging voice dimensions, to also compare them with their internal standard, such as habits (or strategies) and individual perceptual biases, overall sensitivity for the quality to be judged, fatigue, lapses of attention, transcription errors, etc. The first three factors can be shaped by training or the listener's experience, while others must be considered as random errors.
Some factors can interact with factors related to the judgment task. One, for instance, is the ability of listeners to differentiate and interpret different points and intervals in the same classification scale.19 Among these several factors, those related to listeners’ internal standards have received increased attention in voice research.
The literature in the voice area currently reports no significant association between demographic variables (age, level of clinical experience related to voice, speech pathology) and the listeners’ judgement of dysphonic voices.20,21 Bodt et al.22 claim that the professional specialty (for instance, otorhinolaryngologists vs. speech/language pathologists) has a greater influence on the perceptual voice judgment than the number of years of clinical experience, concluding that the evaluator's inexperience has no significant impact on interjudge reliability, provided they have some training prior to the auditory-perceptual voice judgment.
Several authors suggest that to improve the listeners’ reliability, the hypernasality judgement should be performed by a group of evaluators (and not just one), after specific training to adjust the internal scale. During this training, the evaluators must judge reference speech samples with varying degrees of nasality until they reach a consensus.15 It is presumed that internal standards for hypernasality representation are established after exposure to speech samples23 and that they may vary due to the evaluator's level of experience.
Lewis, Watterson and Houghton,24 for instance, observed that experienced evaluators demonstrate better reliability than inexperienced ones, unlike some reports of voice studies in which experienced evaluators exhibited worse reliability than the inexperienced ones. The authors24 explain that this discrepancy may be related to the fact that experienced evaluators participating in hypernasality studies usually work together and, for this reason, may have developed a “common ear” over time.
In the present study, the speech samples were judged by three speech/language pathologists with more than 10 years’ experience in the diagnosis and treatment of speech disorders in patients with cleft lip and palate. Training sessions were carried out with recorded reference samples for the evaluators to identify the occurrence of hypernasality and classify its presence as mild, moderate or severe by consensus. As in the study by Padilha,14 the speech sample of this study consisted of continuously edited sentences, to form a single judgment block. Although the evaluators’ training used the reference samples from the study by Padilha,14 it was observed that the judgment of hypernasality absence through recordings produced worse scores.
The auditory-perceptual assessment not only assesses the state of speech of an individual, but also indirectly provides information on velopharyngeal function in the absence of palatal fistula in the population with cleft palate.25 Thus, it is necessary to have a reliable and valid comprehensive protocol to assess speech. Although it is acknowledged that the auditory-perceptual assessment is considered the gold standard for the evaluation of speech disorders resulting from cleft palate and VPD, it is also recognized that this approach may be somewhat confusing.17 Sell5 states that a speech sample must contain the repetition of syllables and phrases, the production of decorated and spontaneous speech and a conversation sample, agreeing with Hutters and Henningsson,26 who emphasized that the phonetic content of the speech sample can influence the hypernasality perception by listeners.
Silva27 reported the importance of controlling some speech variables, such as the presence of compensatory articulations and audible nasal snort, as these can interfere and hinder the auditory-perceptual judgment of nasality. Compensatory articulations and nasal snort seldom occur in speech samples consisting of low pressure consonants, most often occurring with high-pressure samples.28
The presence of dysphonia may also hinder the auditory-perceptual assessment, as it may distort the evaluation of the degree of hypernasality and further impair the judgment of speech intelligibility.29 As dysphonia and compensatory articulations were not controlled variables in this study, it is difficult to affirm whether their presence in any patient had any influence on the results. Therefore, it is suggested that future studies control for the presence of these alterations, as they may actually interfere with hypernasality judgment.
As an alternative to solve the limitations of live auditory-perceptual evaluation, Lohmander and Olsson,6 Sell5 and Henningsson et al.1 all proposed that the auditory-perceptual judgement be carried out by multiple judges, based on recorded speech samples. They emphasize that the recording is a resource that always can be on hand to be used when and as often as necessary, as well as edited and presented for the auditory-perceptual judgment by multiple judges, which allows validating the clinical findings obtained during the live assessment.
Lohmander et al.6 stress that the use of recordings allows obtaining intra- and interjudge reliability measurements, which contributes to increased scientific credibility of the results. This type of assessment, however, also has some disadvantages that should be considered. One of them concerns the technical quality of the speech sample recording, which can capture ambient noise or might not detect enough acoustic information to allow the judge to identify the presence of weak intraoral pressure, inaudible air leakage and errors related to speech production.26 Another is that during the auditory-perceptual judgment, the judge cannot use the patient's expression to help clarify doubts or observe other visual clues available in the live assessment.
In the present study, the auditory-perceptual judgment of hypernasality, both live and in audio recordings, was carried out using the same four-point scale used by Padilha.14 The results of both studies showed the predominance of mild hypernasality in most judged patients with hypernasality speech.
According to Padilha,14 the auditory-perceptual judgment of mild hypernasality is very close to the judgement of absence of hypernasality on the scale, and the choice between one and the other may have been a difficult task, especially in those patients likely to have fluctuations in nasality speech. Identifying the nasality at the extremes of the range (normal vs. severe hypernasality) has been mentioned by Sommerlad et al.7 as an easier task than identifying small alterations. In this regard, the use of instrumental assessment has been recommended as a way to corroborate the perceptual findings.
Sweeney and Sell10 report the occurrence of a strong correlation between the perceptual evaluations of nasality and nasalance scores due to the use of controlled speech samples and scales to classify hypernasality. However, correlations between nasalance scores and auditory-perceptual judgments should be interpreted with caution.10
This study found significant differences between the perceptual live assessment and THYPER and nasometric findings, in disagreement with the study by Hardin et al.,30 who found that 99% of nasalance scores accurately reflected the auditory-perceptual hypernasality judgment by judges. The present study also found a correlation ranging from regular to moderate between nasometry and the other three types of assessment, similar to the findings of Padilha.14
Watterson, McFarlane and Wright31 affirm that the factor that can interfere in the correlation between nasalance scores and listener's judgments is associated with the speech stimuli used in audio recordings and nasometry. Brunnegård, Lohmander and Van Doorn32 found a good or moderate to good correlation between nasalance scores and perceptual judgment among trained speech language pathologists and regular to moderate among untrained listeners, and mentioned that other speech parameters, such as articulation and voice, can inadequately interfere with the hypernasality judgement.
In the present study, the sensitivity, specificity and overall efficiency of the nasometer were established using the cut-off of 27% and maintaining the live assessment as the gold standard. The results were similar to those of Brancamp, Lewis and Watterson33 and lower regarding sensitivity when compared to those found by Hardin et al.,30 Watterson, Lewis and Deutsch34 and Sweeney and Sell.10
Nevertheless, in order to obtain more information and understanding of hypernasality and its evaluation in the VPD diagnosis after primary palatoplasty, it is suggested that a study be carried out with a large number of patients at different age groups, using different speech samples.
ConclusionWe conclude that the absence of speech hypernasality can be better perceived through the auditory-perceptual judgment performed live and through THYPER, than by the perceptual judgement through recordings of speech samples and nasometry. Although each method has advantages and disadvantages, the biggest advantage of the live assessment, which is the gold standard for detecting the slightest occurrence of hypernasality, is the fact that it is easy to implement and that it can be repeated whenever necessary. However, its disadvantage is that the data cannot be reproduced, or quantified, or shared by other members of the team, or compared with data from other centers. Future studies with greater control of the phonetic context of speech samples are required to improve the reliability of the auditory-perceptual judgement of speech nasality.
Funding sourcesThis study was supported by FAPESP (Fundação de Amparo à Pesquisa do Estado de São Paulo).
Conflicts of interestThe authors declare no conflicts of interest.
Please cite this article as: Larangeira FR, Dutka JCR, Whitaker ME, de Souza OMV, Lauris JRP, da Silva MJF, et al. Speech nasality and nasometry in cleft lip and palate. Braz J Otorhinolaryngol. 2016;82:326–33.


