
Hearing loss can negatively influence the communication performance of individuals, who should be evaluated with suitable material and in situations of listening close to those found in everyday life.
ObjectiveTo analyze and compare the performance of patients with mild-to-moderate sensorineural hearing loss in speech recognition tests carried out in silence and with noise, according to the variables ear (right and left) and type of stimulus presentation.
MethodsThe study included 19 right-handed individuals with mild-to-moderate symmetrical bilateral sensorineural hearing loss, submitted to the speech recognition test with words in different modalities and speech test with white noise and pictures.
ResultsThere was no significant difference between right and left ears in any of the tests. The mean number of correct responses in the speech recognition test with pictures, live voice, and recorded monosyllables was 97.1%, 85.9%, and 76.1%, respectively, whereas after the introduction of noise, the performance decreased to 72.6% accuracy.
ConclusionsThe best performances in the Speech Recognition Percentage Index were obtained using monosyllabic stimuli, represented by pictures presented in silence, with no significant differences between the right and left ears. After the introduction of competitive noise, there was a decrease in individuals’ performance.
A perda auditiva pode influenciar negativamente o desempenho comunicativo e estes indivíduos devem ser avaliados com material adequado e em situações de escuta próximas às observadas no cotidiano.
ObjetivoAnalisar e comparar o desempenho de indivíduos com perda auditiva neurossensorial de grau leve a moderado em testes de reconhecimento de fala apresentados no silêncio e no ruído segundo as variáveis orelha e tipos de apresentação do estímulo.
MétodoParticiparam do estudo 19 indivíduos destros com perda auditiva neurossensorial bilateral simétrica de grau leve a moderado, submetidos ao teste de reconhecimento de fala com palavras em diferentes modalidades e ao teste de fala com ruído branco com figuras.
ResultadosNão houve diferença significante entre as orelhas direita e esquerda para nenhum dos testes realizados. A média de acertos no teste de reconhecimento de fala com figuras, viva voz e monossílabos gravados foi 97,1%; 85,9% e 76,1%, respectivamente, e 72,6% de acertos no teste com ruído.
ConclusõesO melhor desempenho no Índice Percentual de Reconhecimento de Fala foi obtido utilizando como estímulos monossílabos representados por figuras apresentados no silêncio, sem diferenças significantes entre as orelhas direita e esquerda. Com a introdução do ruído competitivo, houve descréscimo no desempenho dos indivíduos.
Hearing is one of the most important senses for humans, considering that the entire human culture is based on communication, with most of it consisting of sound patterns or forms that represent them.1
When damage occurs to the peripheral auditory system, such as permanent sensorineural hearing loss, changes can occur in the patterns of excitatory responses of auditory neurons, as well as changes in the tonotopic maps of the central auditory nervous system (CANS).2
These structural alterations may hinder sound information processing, especially for complex information, such as speech sounds. To assess speech recognition, it is necessary to use higher-threshold measures that will allow the investigation of the communication performance in ideal listening situations and in unfavorable environments.
Speech recognition assessment in silence and with noise can be performed using stimuli presented live or through recordings. The analysis of these tests should be carried out with caution in patients with sensorineural hearing loss (SNHL), as the involvement of the inner ear sensory cells can affect the performance of individuals in speech recognition tasks, especially if the frequencies of 500Hz, 1000Hz, and 2000Hz are impaired.3
Considering that the peripheral hearing loss and the type of stimulus used in the assessment can influence the communication performance of individuals in different everyday environments,4 whether in favorable or unfavorable listening situations, it is hypothesized that individuals with sensorineural hearing loss show better speech recognition when exposed to linguistic stimuli of great redundancy associated with other sensory modalities and worse performance in activities involving auditory closure skills.
Thus, this research aims to analyze and compare the performance of individuals with mild-to-moderate sensorineural hearing loss in speech recognition tests carried out in silence and with noise, according to the variables: ear (right and left) and types of stimulus presentation (live, recorded monosyllables, and pictures).
MethodsThe study was registered at Plataforma Brasil, and analyzed and approved by the Research Ethics Committee, under No. 06654913.5.0000.5505.
A cross-sectional, observational, survey study was conducted; the sample was selected based on the analysis of medical records of patients treated at a service that provides hearing aid devices located in a teaching hospital, in the period between January 2009 and December 2012.
The study inclusion criteria consisted of the following: age between 13 and 59 years (both genders); native speaker of Brazilian Portuguese; preference for the right hand; fluent reading, regardless of the level of education; mild-to-moderate sensorineural hearing loss (mean of the pure tone auditory thresholds at the frequencies of 500Hz, 1000Hz, and 2000Hz up to 55dB HL)5 acquired in the post-lingual period; difference between hearing thresholds of the right and left ear ≤10dB in all the assessed sound frequencies; tympanometric curve type A; presence of I, III, V waves at 80dB nHL in the brainstem auditory evoked potential with absolute latencies and inter-peak intervals within the normal range; absence of middle ear disorders; negative history of otological and/or neurological surgeries; absence of emotional and/or neurological disorders; no previous experience with hearing aid devices; absence of reading, speech, and language complaints and/or impairment; minimum score of 50 in the short version of the Edinburgh Handedness Inventory6,7; minimum performance of 72% of accuracy in the Speech Recognition Percentage Index (SRPI) with monosyllables, presented live; adequacy in the Brief Cognitive Screening Battery,8 adequacy in the verbal fluency test, according to level of schooling,9 and minimum score of nine points in the Clock Drawing Test.10
From January of 2009 to December of 2012, a total of 4516 hearing-impaired individuals were treated at the service. This total number of medical records was analyzed to select the sample components, and 105 patients were considered possible candidates. After the initial contact by telephone, 72 individuals were invited to undergo sample selection procedures; of these, only 19 individuals met all eligibility criteria and completed all stages of study assessment.
Thus, the final sample consisted of 19 individuals, 13 (68.4%) males and six (31.6%) females. Regarding age and education, the individuals were aged between 16 and 59 years (mean 39.4 years) and had 3–20 years of schooling (mean 10.2 years). All individuals had mild-to-moderate symmetrical bilateral sensorineural hearing loss, acquired in the postlingual period.
For the speech recognition assessment in silence and with noise, the following instruments were used: a soundproof booth, a Philips Expanium Discman, a Grason-Stadler GSI-61 audiometer, and a pair of TDH-50P supra-aural headphones, and compact discs and pictures from the books of behavioral hearing tests for central auditory processing evaluation.11
The evaluation with the SRPI using monosyllables was performed with live voice (SRPI-L) and with recordings (SRPI-R) using a list of monosyllables12 presented at 40dB SL, considering the mean of the pure tone auditory thresholds at the sound frequencies of 500Hz, 1000Hz, and 2000Hz, or at the comfort level reported by the patient. All evaluations started in the right ear.
Lists D1 and D2 were used for the live voice presentations (SRPI-L), whereas lists D3 and D4 were used for the evaluations with recorded monosyllables (SRPI-R), recorded on a compact disc.11 In both situations, the individual was asked to repeat the words and a 4% percentage was attributed to each correct response. Results of 92% of correct responses or more in both ears were considered adequate, i.e., no difficulty in understanding speech in silence.13
The Speech Recognition Percentage Index using pictures (SRPI-P) was performed using the compact disc.11 Ten monosyllabic and disyllabic words were presented, depicted in pictures, to each ear at 40dB SL, considering the mean of the pure tone auditory thresholds at the sound frequencies of 500Hz, 1000Hz, and 2000Hz, or at the comfort level reported by the patient. The individual was instructed to point out, on a poster attached to the wall, the picture that corresponded to the word heard. A 10% percentage was assigned for every correct response and the correct identification of at least nine pictures was considered adequate.
The speech test with white noise and pictures (STWN-P) was carried out with 20 monosyllabic and disyllabic words, ten for each ear, recorded on a compact disc11 and presented at 40dB SL, considering the mean of the pure tone auditory thresholds at the sound frequencies of 500Hz, 1000Hz, and 2000Hz, or at the comfort level reported by the patient. Simultaneously to the presentation of the stimuli, white noise was introduced in the same ear, at a signal/noise ratio of +5. The individual was instructed to point out, on a poster attached to the wall, the picture that corresponded to the word heard. A 10% percentage was assigned for every correct response and 90% accuracy or more was considered as an adequate performance.11
The statistical analysis was carried out using Minitab (v. 16), SPSS (v. 18), and R (v. 2.14.2). The significance level was set at 0.05 for each hypothesis test.
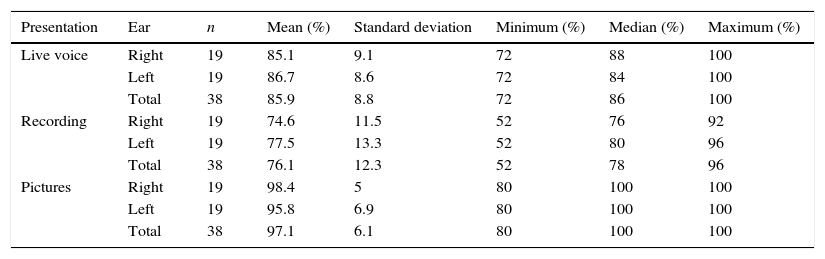
ResultsInitially, the descriptive statistics values of the percentage of correct responses in the SRPI test in all conditions: live voice, recording (recorded monosyllables), and pictures are shown in Table 1.
Descriptive statistics values for the percentages of correct answers in the Speech Recognition Percentage Index by ear.
| Presentation | Ear | n | Mean (%) | Standard deviation | Minimum (%) | Median (%) | Maximum (%) |
|---|---|---|---|---|---|---|---|
| Live voice | Right | 19 | 85.1 | 9.1 | 72 | 88 | 100 |
| Left | 19 | 86.7 | 8.6 | 72 | 84 | 100 | |
| Total | 38 | 85.9 | 8.8 | 72 | 86 | 100 | |
| Recording | Right | 19 | 74.6 | 11.5 | 52 | 76 | 92 |
| Left | 19 | 77.5 | 13.3 | 52 | 80 | 96 | |
| Total | 38 | 76.1 | 12.3 | 52 | 78 | 96 | |
| Pictures | Right | 19 | 98.4 | 5 | 80 | 100 | 100 |
| Left | 19 | 95.8 | 6.9 | 80 | 100 | 100 | |
| Total | 38 | 97.1 | 6.1 | 80 | 100 | 100 |
The results obtained in this population were compared to the normality criteria for individuals with normal hearing. No significant differences were observed between the frequency of normal and altered results for the right and left ears in any of the presentation conditions (McNemar test: live, p=0.125; recorded monosyllables, p=0.070; pictures, p>0.999). The frequency of individuals with adequate results in the live test and the test with pictures, considering both ears, was 26.3% and 89.5%, respectively. No individual showed the test adequacy for the presentation with recorded monosyllables.
When comparing the means of correct response percentages according to the three SRPI test conditions (live×recording×pictures) using analysis of variance with repeated measures, there was no statistically significant difference between the mean percentage of correct answers in the right and left ears (p=0.628), but there was a statistically significant difference between the test application conditions (p<0.001*). These conclusions were valid for the three conditions of test application, as there was no interaction between the test application condition and the ear (p=0.199).
As there were differences between the means of correct answer percentages in the three test application conditions (live×recording×pictures), the analysis continued, aiming to find where these differences occurred. Therefore, the mean percentages of correct responses were compared two by two, using the Bonferroni procedure.
When comparing the SRPI test application conditions of live×recording, there was a statistically significant difference in the mean percentage of correct answers (p<0.001*). The performance of the test subjects with the live presentation was better than with the recorded monosyllables; the difference was, on average, 9.8% (95% CI: 6.7–13.0).
The comparison of the SRPI test application conditions of live×pictures also showed a statistically significant difference (p<0.001*). The mean percentage of correct answers in the test with pictures was higher than the live test; this difference was, on average, 11.2% (95% CI: 8.1–14.3).
When comparing the SRPI test application conditions of recorded monosyllables×pictures, there was a statistically significant difference in the mean percentage of correct answers (p<0.001*). The performance of the subjects in the test with pictures was better than with the recorded monosyllables, but that difference was, on average, 21.1% (95% CI: 17.9–24.2).
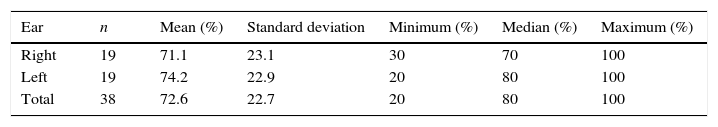
To assess the performance of individuals with mild-to-moderate sensorineural hearing loss with the introduction of competitive noise, the speech test with pictures was conducted with white noise (Table 2).
Descriptive statistics values for the percentages of correct answers in the speech test with white noise and pictures according to the right and left ears.
| Ear | n | Mean (%) | Standard deviation | Minimum (%) | Median (%) | Maximum (%) |
|---|---|---|---|---|---|---|
| Right | 19 | 71.1 | 23.1 | 30 | 70 | 100 |
| Left | 19 | 74.2 | 22.9 | 20 | 80 | 100 |
| Total | 38 | 72.6 | 22.7 | 20 | 80 | 100 |
When the inferential analysis of the Speech Test With White Noise was performed using the paired t-test, no statistically significant differences were observed when comparing the means of the percentages of correct responses in the right and left ears (p=0.301).
The results obtained in this population were compared to the normal criteria established for individuals with normal hearing, in which only 26.3% of individuals showed adequate results, considering both ears. There was no statistically significant difference between the right and left ears for the frequencies of the normal and altered results (McNemar test, p=1).
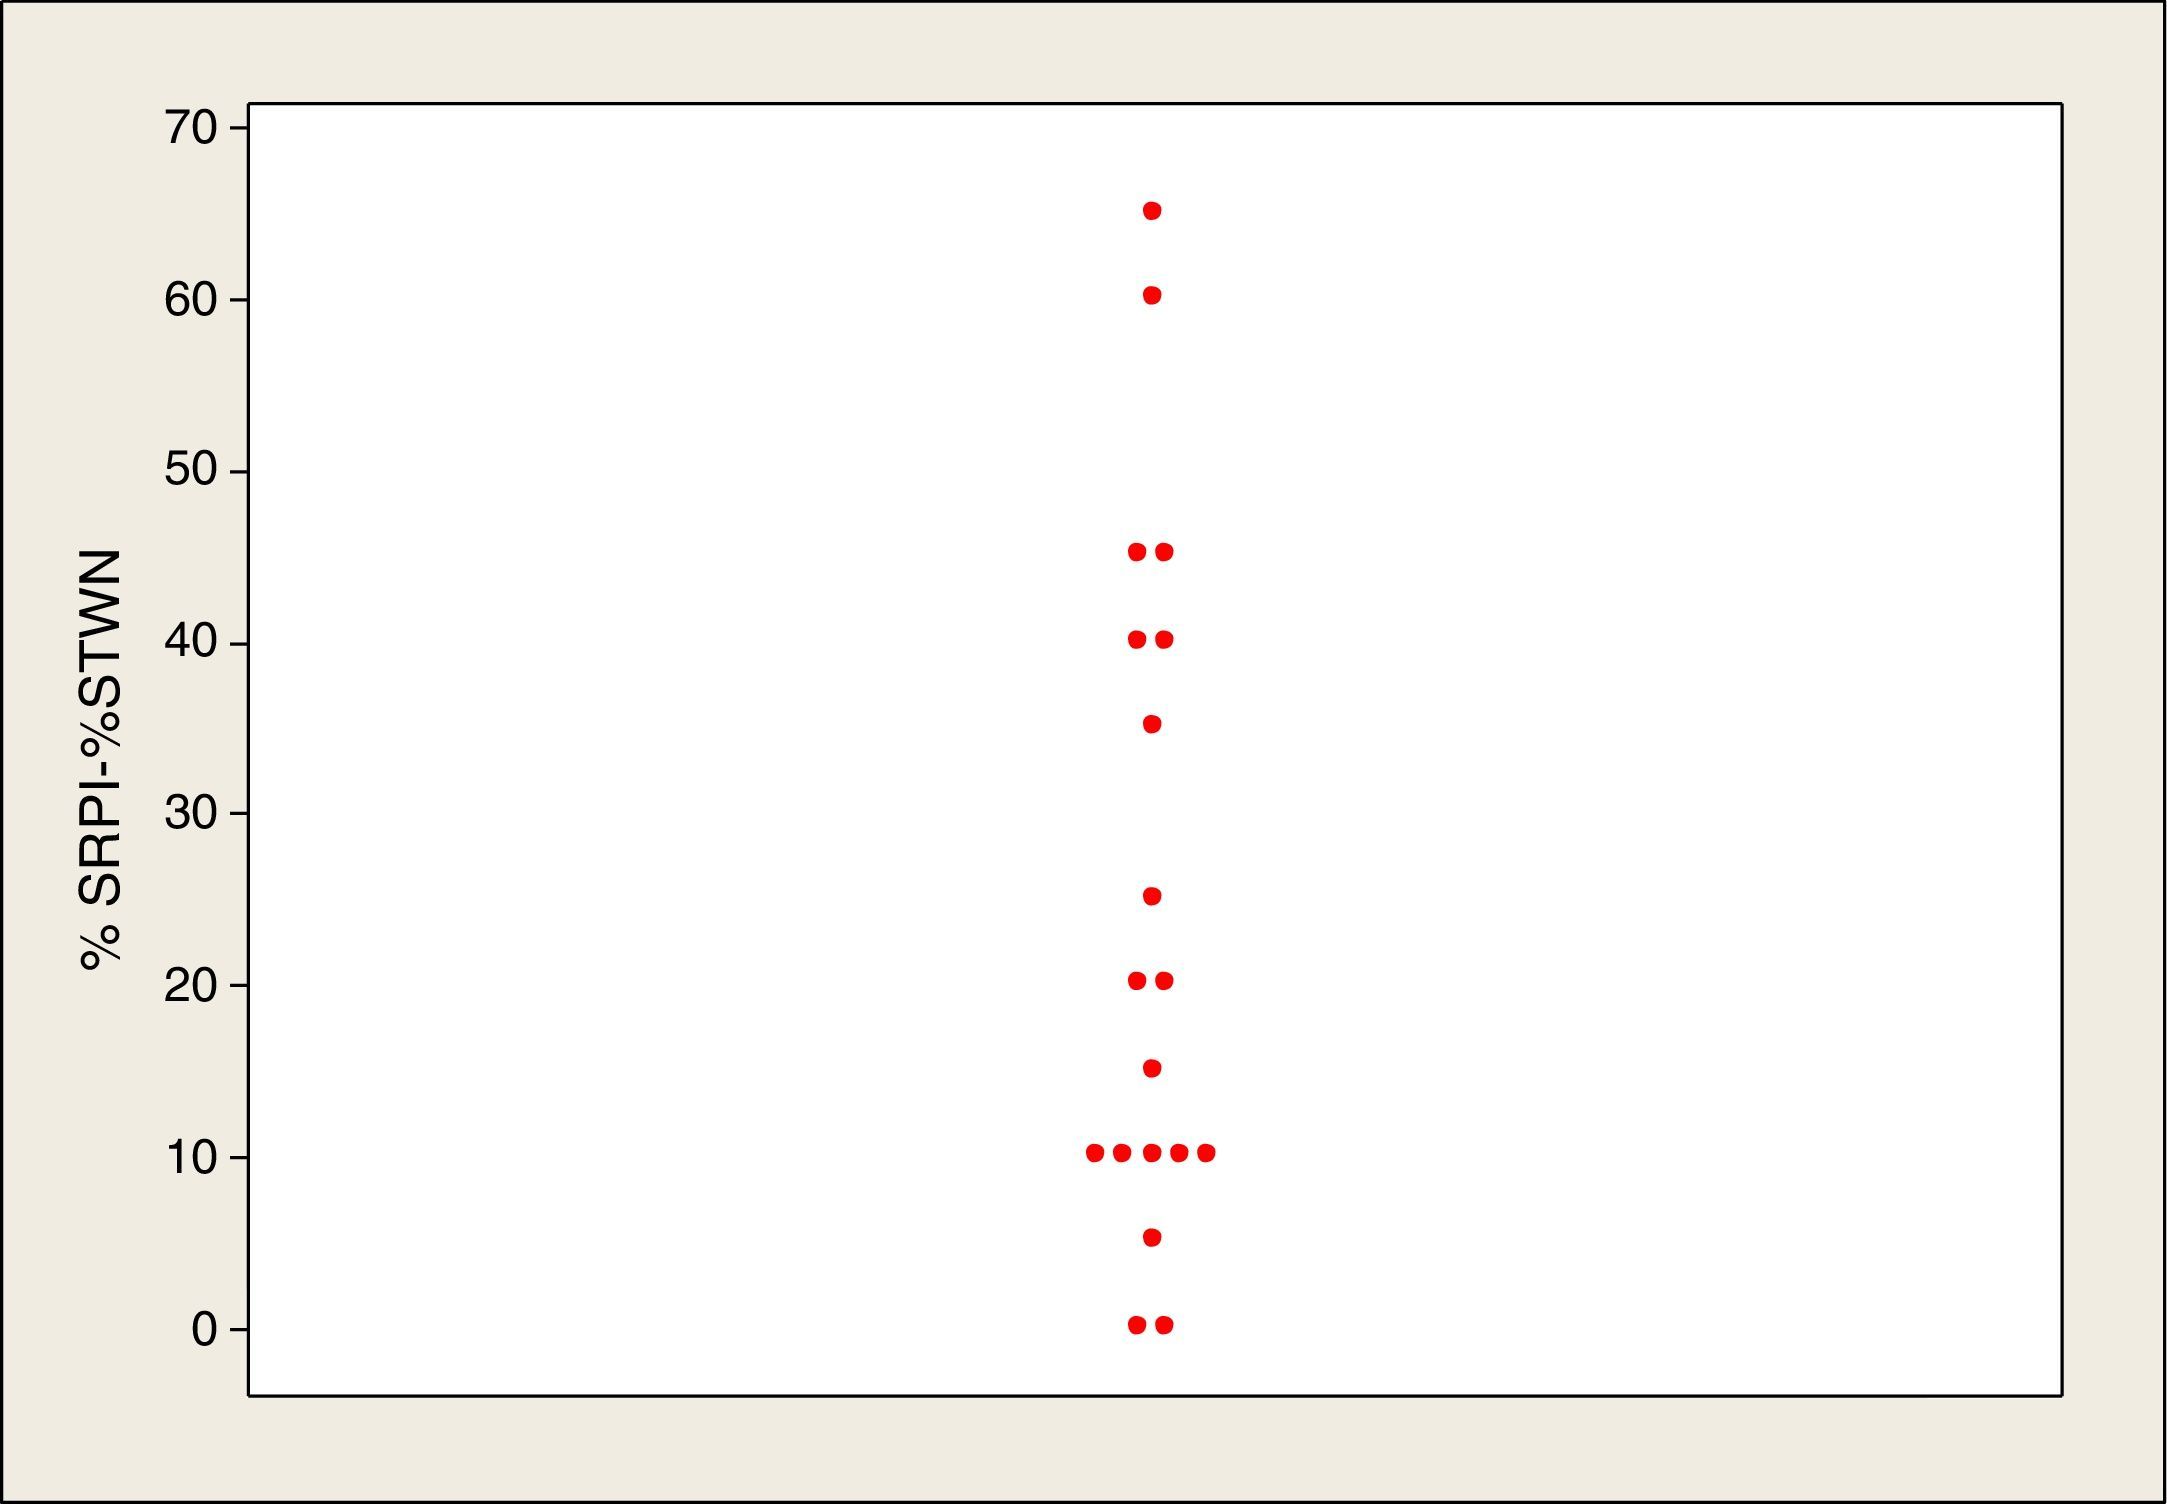
To assess whether the introduction of competitive noise interfered with speech recognition, the SRPI-P and STWN with pictures were compared (Fig. 1).
.")
When comparing the differences in percentages of the SRPI-P test and STWN-P, it was observed that all differences were greater or equal to zero, indicating that the percentage of correct answers in the SRPI-P was higher than in the STWN-P for all individuals in the sample.
At the inferential analysis using the paired t-test, it was observed that the mean of the percentages in the SRPI-P was higher than in the STWN-P (p<0.001*). The mean difference between the percentages in the two tests was 24.5% (95% CI: 14.9–34.0).
DiscussionThe assessment of speech recognition capacity using special hearing tests should consider the classification of the degree and type of hearing loss, to allow the evaluation of the subjects’ actual difficulty caused by the sensorineural hearing loss.14
Individuals with sensorineural hearing loss have better performance in tests that evaluate speech recognition when the words are presented at a more comfortable hearing level.3 Such care was taken in this study, but it also aimed to assess the possible influence of the stimulus type on the percentage results of the SRPI tests. Therefore, the test was carried out with three types of presentation: live voice, recording (recorded monosyllables), and recorded words with pictographic representation (pictures).
The descriptive (Table 1) and inferential analysis of results of the Speech Recognition Percentage Index showed that within the same application condition, the mean results on the right and left ears were similar, but the means of percentages of the correct monosyllables with recorded stimuli were lower than the means obtained with the live presentation and with pictures.
The similarity between the results in the right and left ears in all SRPI test application conditions was expected, as all the individuals had symmetrical sensorineural hearing loss. Regarding the performance in the SRPI test with monosyllables presented with live voice, the type of stimulus presentation most commonly used in clinical practice, there was a divergence between the results of the present study when compared with previous studies,14,15 which found a mean performance of 75.99% correct14 and 56.4% correct15 responses.
The discrepancy between the results obtained in this study with those found by other authors14,15 can be attributed to the fact that the individuals included in the comparison studies were elderly (mean age of 77.914 and 65.515 years). Hearing loss that results from aging is usually associated with a decreased performance in speech recognition tests, with no previous history of systemic or auditory disorders.16 Such alterations are due to a deficit in central auditory processing, justifying the poor performance of individuals when compared to those in the present study.
The results obtained are below those established for individuals with normal hearing, but this result was expected, as the population assessed in this study has peripheral hearing loss, which, even when mild, can negatively influence the capacity to discriminate between speech sounds using tests with recorded audio stimuli, particularly with low redundancy and predictability stimuli.
The analysis of results in comparison to the different forms of stimulus presentation in the SRPI was performed per ear, but there were no statistically significant differences between the performances of the right and left ears. Therefore, the results will be discussed considering that both ears had normal or altered results.
The frequency of individuals who showed adequate results in both ears for the SRPI presentation with live monosyllables was 26.3%. None of the assessed individuals showed adequate results bilaterally in the SRPI test presentation with recorded monosyllables, showing greater compatibility with pure tone audiometry, and 89.5% of the individuals showed adequate results in the SRPI test presentation with pictures.
When comparing the test application conditions, significant differences were found, in which the subjects’ performance on the test with the live voice presentation was better than with recorded monosyllables, and worse than the test with pictures. When comparing the application conditions of recorded monosyllables and pictures, better results were observed for the test application with pictures.
The extrinsic and intrinsic redundancies of a stimulus directly influence individuals’ performance in speech recognition tests. Extrinsic redundancies are related to acoustic and linguistic signal characteristics, whereas intrinsic redundancies are related to the structure and physiology of the auditory pathways that transmit information to the central auditory system.17 The effect of the stimulus redundancy on the SRPI test performance was observed in this study, considering that, as the extrinsic redundancy signal decreased, the individuals’ performance worsened.
Currently, in clinical practice, most professionals apply the SRPI test with live presentation; however, the results shown here demonstrated that the recorded stimuli should be routinely used, as the recorded application standardizes the assessment, allows the comparison of performance at different moments, and decreases the extrinsic redundancy and the evaluator's influence on the final result. With all these advantages, the assessment sensitivity and coherence with the complaint reported by individuals with SNHL, i.e., that they can hear, but not understand what has been said, increases. However, the use of recorded stimuli implies higher costs in auditory assessment, as the professional will require other available tools in addition to the audiometer for this kind of test presentation.
Auditory closure skills are related to the individual's capacity to recognize full auditory information, even when part of the information is distorted or suppressed. Individuals with NSHL have a reduced capacity to understand auditory information in acoustically unfavorable environments, especially in noisy ones.18
Similarly to the outcome of the application of the SRPI test, the analysis of the speech test with white noise and pictures showed no statistically significant differences between the percentages of correct responses in the right and left ears, with a mean in both ears of 72.6% accuracy (Table 2). Even with the extrinsic redundancy increase, individuals still exhibited reduced performance in the STWN with pictures; only 26.3% of the individuals showed adequate test response when compared to the normal criteria established for individuals with normal hearing. Consequently, it can be inferred that the worsened performance was due to the introduction of competitive noise.
Alterations in the spatial processing of sound are associated with incapacities in the selection and suppression of the sound stimulus that reaches the auditory system, making it difficult to understand speech in acoustically unfavorable environments, especially noisy ones.19 Although the speech test with white noise and pictures is easy to apply and respond to, it is challenging for the CANS in the assessment of patients with mild-to-moderate sensorineural hearing loss, disclosing an alteration in the auditory closure skill.
In clinical practice, the performance at the speech test with white noise and pictures is assessed in comparison with SRPI-P; in this context, better results were observed in the assessment carried out in silence. Thus, it can be said that the introduction of competitive noise, even with a positive signal to noise ratio (S/N=+5) as in the STWN with pictures, hindered speech recognition; this difference averaged 24.5% when compared to the ideal listening situation (no noise). This decrease in speech recognition performance with the introduction of competitive noise20 can occur under the influence of cochlear alteration due to peripheral hearing loss and/or changes in the auditory closure skills.
Speech recognition tests assess the individual's social hearing in situations similar to those observed in daily life, and provide information about the skills and limitations of each individual, which determine the capacity to communicate.21 When a noise is introduced simultaneously to a stimulus that may or may not be speech, part of the information is degraded by the introduction of this competitive stimulus, which hinders communication, as observed with the individuals in this study; however, the use of speech recognition tests in silence and with competitive noise is recommended,22 especially in the assessment of patients with mild hearing loss who report no communication difficulties and perform well in conventional tests.
Due to the negative influence of peripheral hearing loss on speech recognition tests, the benefits of using contextual clues for such assessment,16 and the findings observed in the present study, it is suggested that the evaluation of speech recognition and auditory closure skills in subjects with mild-to-moderate sensorineural hearing loss should be performed using the speech recognition test with pictures in silence and with noise. This is a rapid tool that can be applied with earphones as well as in a sound field, and can also be applied to individuals with hearing loss with different educational levels, whether or not they are users of hearing aids.
Knowing that several factors can affect the results obtained in speech recognition tests, further studies are required to assess the possible influence of some variables, such as educational level, type of peripheral hearing loss, and the material used in speech recognition test performance.
The influence of education could be analyzed using different educational levels in individuals of same age and gender. The influence of peripheral hearing loss can be investigated in relation to the type of loss (sensorineural, conductive, or mixed), degree of loss (mild, moderate, or moderately severe), and audiometric configuration. Finally, the evaluation of speech recognition using test monosyllables represented by pictures could be compared to more redundant stimuli, such as by using sentences as target stimulus.
ConclusionsIn patients with mild to moderate sensorineural hearing loss, aged 16–59 years, who did not use hearing aid devices, it was concluded that:
- -
There was no difference regarding the laterality of the tested ear in the four test conditions.
- -
There was a significant difference between the four SRPI test conditions, with better results obtained for the SRPI with pictures.
- -
The performance at the STWN was worse than that at the SRPI with pictures, showing difficulty in auditory closure skills.
This study was funded by Coordenação de Aperfeiçoamento de Pessoal de Nível Superior – CAPES.
Conflicts of interestThe authors declare no conflicts of interest.
Please cite this article as: de Andrade AN, Iorio MCM, Gil D. Speech recognition in individuals with sensorineural hearing loss. Braz J Otorhinolaryngol. 2016;82:334–40.
This work is part of the Ph.D. thesis in science by the program of Human Communications Disorders – Speech Therapy and Audiology Department of Universidade Federal de São Paulo and was performed at the Núcleo Integrado de Assistência, Pesquisa e Ensino em Audição (NIAPEA) of the Discipline of Hearing Disorders of the Department of Speech Therapy and Audiology of Universidade Federal de São Paulo.
gology is pleased to honor the reviewers


