
The obstructive sleep apnea syndrome (OSAS) reduces attention span, memory and concentration capacities, all associated with cognition. The analysis of the auditory P300 parameters could help infer cognitive dysfunction.
ObjectiveTo compare the data from polysomnography and the auditory P300 in adults, primary snorers with OSAS patients.
Materials and MethodsProspective study with primary snorers (N=12) and in OSAS patients (N=54), submitted to polysomnography, defined by the apnea-hypopnea index (AHI). The polysomnography and P300 variables were compared by the t-Student test, the Exact Fisher's Test, logistic regression and analysis of correlation with a significance level of 5%.
ResultsAIH had an inverse correlation with the oximetry in both groups. The P300 prevalence was lower in the OSAS group (Fisher's Exact Test, p=0.027). Patient age did not influence the P300 prevalence (regression analysis; p=0.232). The P300 amplitude was lower in the OSAS group (t-Student test; p=0.003) and the P300 latency was similar in both groups (t-Student test; p=0.89).
ConclusionThe reduction in the P300 amplitude in patients with OSAS suggests cognitive dysfunction induced by a reduction in auditory memory.
The Obstructive Sleep Apnea Syndrome (OSAS) – causes a change to normal sleep architecture, with sleep fragmentation, hypoxia and frequent awakenings. Chronic sleep deprivation and fragmentation reduce its restorative capacity, induce excessive daily sleepiness, and reduce attention span, reduce memory and concentration, amongst other symptoms. Attention span, memory and concentration capacity are closely related to cognition1.
On the other hand, the auditory P300 is an electrophysiological event, depending on a previous acoustic experience, and it is a sensorial perception brain process. It is triggered by the individual's reaction to a previously established acoustic stimulus, it reflects the conscious interaction of the auditory system with the somatosensorial cortical area and requires the active mental participation of the patient. By analyzing its parameters, the P300 - known as a neuropsychobiological event – one can infer about the cognitive function in an objective fashion2,3.
Case-control clinical studies carried out with individuals subjected to a forced sleep deprivation showed latency extension and reduction in the auditory P300 amplitude in the study group. These results have suggested that the P300 changes in the study group were reflexes from lowering the state of awareness, which extends the reaction time4-6. The cognitive deterioration induced by sleep deprivation is a consequence of neurophysiological changes, demonstrated by reduction in amplitude and increase in P300 latency.
OSAS repercussion studies about P300 parameters are rare. Primary snorers and people with mild OSAS do not have changes to P300 latency and amplitude; patients with moderate to severe OSAS have an increase in P300 latency7-10.
OBJECTIVETo assess changes in P300 amplitude and latency among primary snorers and patients with OSAS classified by polysomnograms.
MATERIALS AND METHODSThis paper was approved by the Ethics in Research Committee of our Institution, under protocol number 117/2006. The individuals who participated in the study were given and agreed with the Informed Consent Form.
We assessed 66 patients, from both genders, in the age ranges between 22 and 59 years. The recording was prospective and sequential, between December of 2006 and November of 2007.
The individuals were divided into two groups; a control group (CG), made up of 12 snorers, and a study group (SG), made up of 12 primary snorers, and a study group (OSAS G.), made up of 54 people with OSAS. All 66 individuals were submitted to polysomnogram and were classified according to criteria from the American Academy of Sleep Disorders and from the Brazilian Association of Sleep Medicine11.
The following exclusion criteria were equally employed in both groups:
- •
Conductive hearing loss, mixed or sensorineural, unilateral or bilateral, with mean values at the eighths of the frequencies between 500 and 4000 Hz greater than 25 dBHL.
- •
External and middle ear disorder.
- •
Patients with neurological disorders or dementia12,13 and diabetes mellitus14.
- •
Inclusion criteria for the control group:
- —
HAI: lower than 5 events/h
- —
Average oxymetry higher than 88%
- —
- •
Inclusion criteria for the OSAS group
- —
HAI: greater than 5.1 events/h
- —
OSAS diagnosis, except for other sleep disorders.
- —
The polysomnogram was analyzed by the Meditron-Sonolab 620 device with 20 channels. The test was carried out at night, following the individual's circadian cycle, during physiological sleep. We recorded encephalography; electro-oculography; EKG; oronasal air flow; chest, abdominal and body position sensors; digital oxymetry; chin and anterior tibia electromyography.
The OSAS classification, according to the Hypopnea and Apnea Index (HAI), followed the criteria from the American Academy of Sleep Disorders and those from the Brazilian Association of Sleep Medicine11:
- •
Normal: HAI between 0 and 5 events per hour
- •
Mild OSAS: HAI between 5.1 and 15 events per hour
- •
Moderate OSAS: between 15.1 and 30 events per hour
- •
Severe OSAS: greater than 30.1 events per hour. The oxyhemoglobin saturation was considered
normal when it was higher than 90%; should it be lower than this, without exceeding the 3% of the Total Sleep Time (TST).
In order to assess the auditory P300, we used the device from Biologic's Evoked Potential System - version 6.1.0. The test was carried out between 8 and 10 o'clock in the morning, in a silent room, with the use of 3A “in the ear” phones. We utilized disposable electrodes; the active electrodes were placed on Cz and Fz; the reference electrode was on A2; and the ground electrode was placed on Fpz, according to international references10-20; we used impedance equal to or lower than 2 kΩ between the electrodes. The test technique was the target stimulus model. The target stimulus was the tone burst in the frequency of 2 kHz, randomly presented, in the probability of 20% of the stimuli; the frequent stimulus was made up by the tone burst in the frequency of 1kHz, with 80% probability of presentation. The series of stimuli was of 250 stimuli at an interstimuli frequency of 1/s. The sound intensity of both stimuli was of 70 dB SPL and binaural. The response triggered by the perception of the stimuli was motor, requiring individuals to raise one of the fingers in their hands when they perceived rare stimuli.
In assessing the results, we considered the Fz register as standard for reproducibility and the Cz register for wave analysis.
The P300 was measured in amplitude and latency. The amplitude in microvolt (μv) was defined as being the potential difference between the baseline and the apex of the positive wave. Latency in milliseconds (ms) was defined as the period of time between the onset of the stimulus all the way to the wave apex.
In the presence of P300, we created the latency and amplitude tables, according to age, the HAI and oxyhemoglobin saturation in building scatter graphics.
The study of the P300 prevalence between the two groups was carried out by the Fisher's exact test. The P300 prevalence and age range analyses were carried out by the simple regression logistics test.
We carried out t-Student tests for independent samples, in order to compare the values of P300 latency and amplitudes, between the two groups.
In the applied statistical tests, we used a 5% significant level (α = 0.05).
RESULTSThe CG had six men and six women; the mean age was 34.41 years, ranging between 22 and 54 years.
The OSAS Group had 46 men and eight women; with a mean age of 43.53 years, ranging between 24 and 59 years.
In the control group, the mean HAI was 2.61/h and it happened between 1.2/h and 4.6/h. The mean nadir of oxyhemoglobin saturation was 88%, and it varied between 77% and 94%; saturation below 90% did not exceed 2.7% of the TST.
In the OSAS group, the mean HAI was 39.51/h and it varied between 5.4/h to 106.7/h. The mean oxyhemoglobin saturation nadir was 79.07% and it varied between 61% and 98%; saturation below 90% had a mean percentage value of 18.64% of the TST.
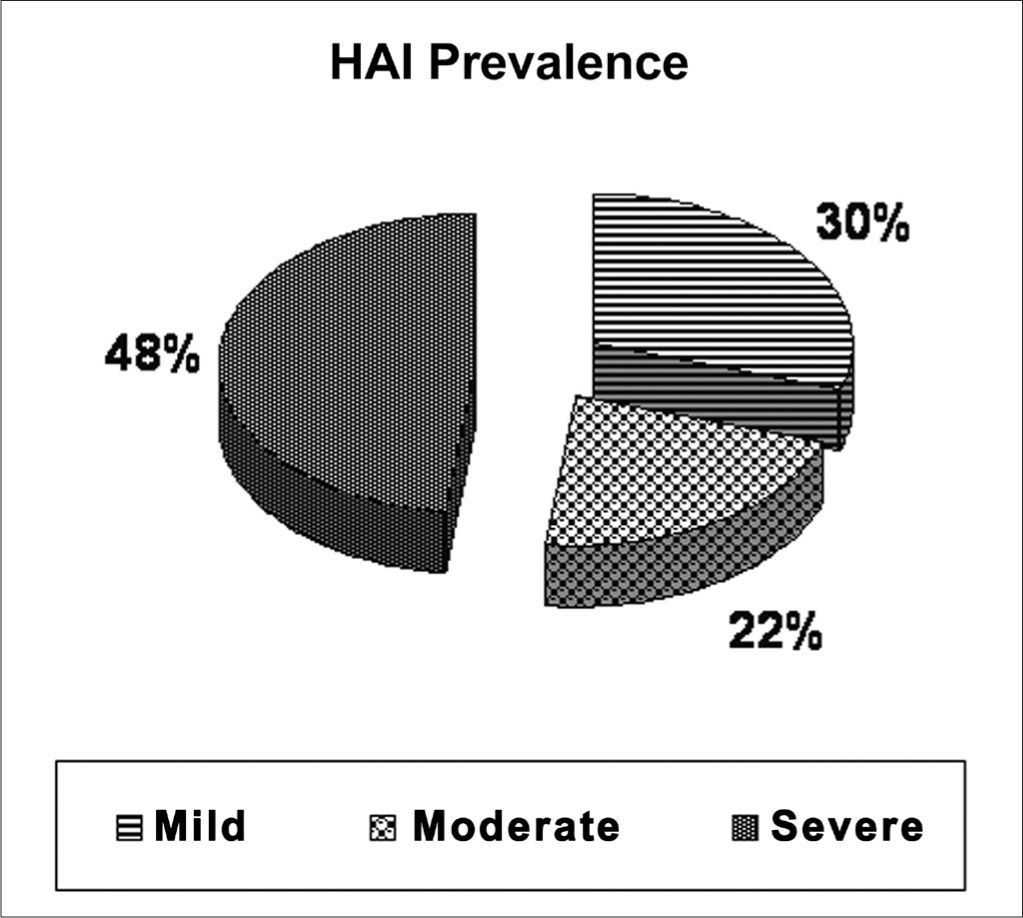
The percentage distribution according to the apnea severity in the OSAS group was mild in 30% (16/54), moderate in 22% (12/54) and severe in 48% (26/54) (Figure 1).

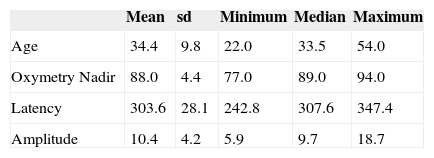
P300 was recorded from all individuals in the CG. The mean latency was 303.56ms and it fluctuated between 242.80ms and 347.42ms; the mean amplitude was 10.40μV and it oscillated between 5.88μV and 18.7μV.
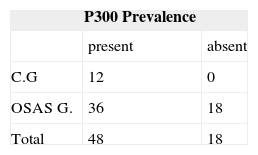
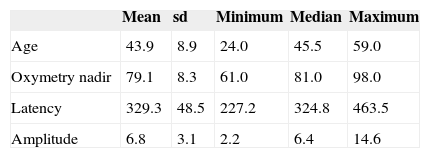
P300 was recorded in 66.67% (36/54) of the individuals from the OSAS group. Mean latency was 329.29ms; and it varied between 227.18ms and 463.49ms; the mean amplitude was 6.77μV and it varied between 2.22μV and 14.60μV (Table 1).
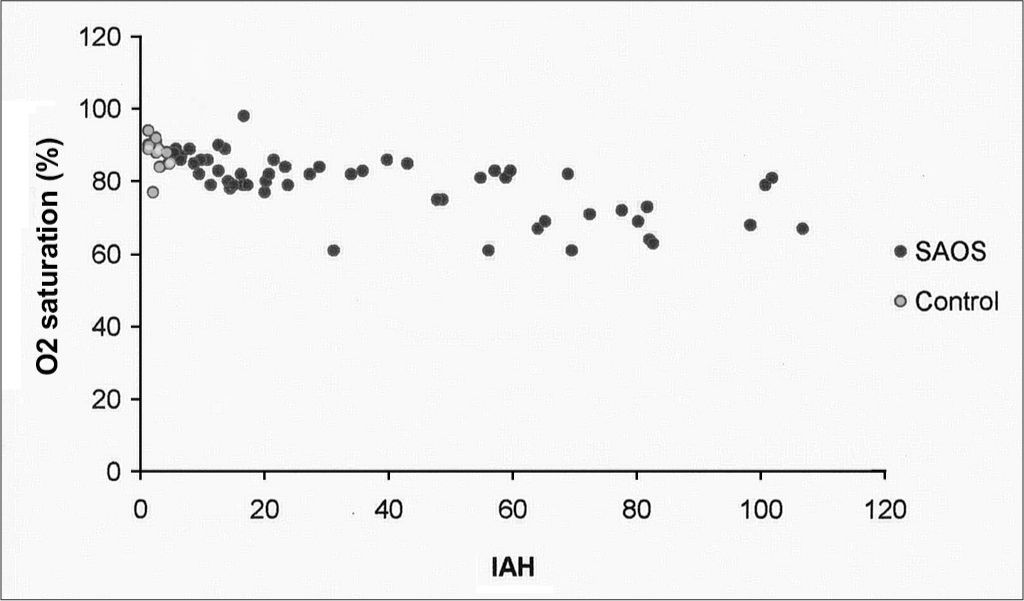
In the scatter charts of P300 variables (amplitude and latency) and considering the polysomnogram (HAI, oxymetry), there was an inverse correlation between HAI and the oxymetry (Figure 2).

The prevalence of the auditory P300 in the OSAS group (66.7%) was lower than that in the CG (100%) (Fisher's Exact Test; p=0.027).
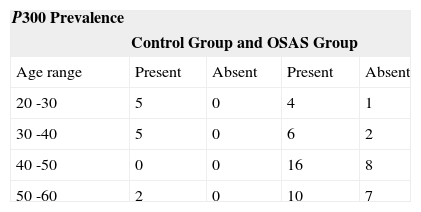
In both groups, age did not influence the P300, through the logistic regression analysis (p=0.232) (Table 2).
Tables 3 and 4 show the P300 minimum and maximum values, the mean, median and standard deviation (SD) of age, oxymetry, and amplitude/latency in the CG and OSAS Group.
Control group: mean, standard deviation; minimum, maximum and median values for age, oxymetry nadir and P300 latency/amplitude (N=12).
| Mean | sd | Minimum | Median | Maximum | |
|---|---|---|---|---|---|
| Age | 34.4 | 9.8 | 22.0 | 33.5 | 54.0 |
| Oxymetry Nadir | 88.0 | 4.4 | 77.0 | 89.0 | 94.0 |
| Latency | 303.6 | 28.1 | 242.8 | 307.6 | 347.4 |
| Amplitude | 10.4 | 4.2 | 5.9 | 9.7 | 18.7 |
OSAS group: mean, standard deviation; minimum, maximum and median values for age, oxymetry nadir and P300 latency/amplitude (N=54).
| Mean | sd | Minimum | Median | Maximum | |
|---|---|---|---|---|---|
| Age | 43.9 | 8.9 | 24.0 | 45.5 | 59.0 |
| Oxymetry nadir | 79.1 | 8.3 | 61.0 | 81.0 | 98.0 |
| Latency | 329.3 | 48.5 | 227.2 | 324.8 | 463.5 |
| Amplitude | 6.8 | 3.1 | 2.2 | 6.4 | 14.6 |
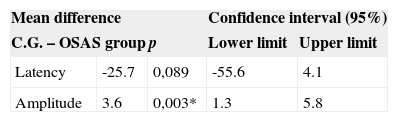
The P300 amplitude was lower in the OSAS Group, by the mean amplitude difference between the CG and the OSAS group (mean difference =3.6uV; p=0.003; CI:1.3 – 5.8; t-student test); latency was similar in both groups, by the mean latency difference between the CG and the OSAS group (mean difference =25.7; p=0.089; CI: -55.6 - 4.1, t-Student test) (Table 5).
DISCUSSIONPatients with neurologic disorders12,13 and diabetes mellitus14 were taken off the study because of P300 changes caused by these disorders.
The hearing loss exclusion criteria was established in order to avoid biases; individuals with peripheral hearing loss may influence the P300 and compromise the obtained results15.
The P300 was executed following the individual's circadian cycle in the morning, when the awareness and concentration status are ideal and favor the P300 generation16,17. The response required from the target stimulus was motor, in order to maintain the state of awareness - factors which favor the P300 acquisition12,18.
In the present study, the CG, made up of primary snorers, had a prevalence of 58.33% of individuals with more than 40 years, and in a 1:1 ratio, as far as gender is concerned. The OSAS Group had a prevalence of 90.75% of individuals with more than 40 years, and in a 5:1 ratio favoring males. This age and gender prevalence in the OSAS group has been reported by most authors1,19,20. The decision to use primary snorers in the primary snorers CG, instead of asymptomatic volunteers, brought about an unexpected bias as far as age is concerned: the mean age of the CG (34.41 years) was lower than that of the OSAS group (43.52 years). The likelihood of a snorer with more than 40 years of age having OSAS is higher and proportional to age1,13, and this made it difficult to have a CG sample of equal age range from that of the OSAS group.
The analysis of the scatter chart between the P300 and polysomnogram variables in both groups showed that the only variables which had a correlation were HAI and oxymetry; such correlation was inverse, and the higher the HAI, the lower the oxyhemoglobin saturation values. The brain cortex and the hippocampus, P300 generation structures, were described as being particularly sensitive to hypoxemia21; and hypoxemia may induce neuronal lesions and hippocampus atrophy, which restricts the neurocognitive performance22.
The P300 prevalence was significantly lower in the OSAS Group – 66.67% (36/54). Such data may be justified by the fact that 70% of the individuals with OSAS had the moderate and severe types; therefore, with a greater impairment in awareness, attention and concentration3,23. On the other hand, there are papers reporting P300 changes in individuals with OSAS; however, without mentioning the absence of such potential7, 24.
The P300 amplitude in the OSAS Group was significantly lower. The amplitude reflects brain activity in the parietal-temporal and pre-frontal areas, associated with the auditory memory6,15 which would be reduced in individuals with OSAS.
In the present study, the P300 latency was not a sensitive parameter in OSAS patients. Latency is associated to the interstimuli frequency to the individual's attention and concentration15,25. The studies which showed a significant delay in P300 latency had individuals with severe OSAS13, of sleep deprivation associated with forced awakeness6 and because of their circadian cycle phase17.
On the other hand, a study involving individuals with OSAS showed that the attention deficit is more severe in young people, when compared to elderly (threshold age: 50 years), and that age it does not interact with OSAS in worsening the cognitive deficit26.
CONCLUSIONThe reduction in auditory P300 amplitude in the OSAS patients of the present study suggests a cognitive dysfunction, induced by the impairment in auditory memory.
ENT Program – Medical School of the Sta. Casa de S. Paulo
Paper submitted to the BJORL-SGP (Publishing Management System – Brazilian Journal of Otorhinolaryngology) on May 01, 2011; and accepted on July 14, 2011. cod. 7747


