
There is still no consensus in the literature as to the best acoustic stimulus for capturing vestibular evoked myogenic potential (VEMP). Low-frequency tone bursts are generally more effective than high-frequency, but recent studies still use clicks. Reproducibility is an important analytical parameter to observe the reliability of responses.
ObjectiveTo determine the reproducibility of p13 and n23 latency and amplitude of the VEMP for stimuli with different tone-burst frequencies, and to define the best test frequency.
MethodsCross-sectional cohort study. VEMP was captured in 156 ears, on the sternocleidomastoid muscle, using 100 tone-burst stimuli at frequencies of 250, 500, 1000, and 2000Hz, and sound intensity of 95dB nHL. Responses were replicated, that is, recorded three times on each side.
ResultsNo significant difference was observed for p13 and n23 latencies of the VEMP, captured at three moments with tone-burst stimuli at 250, 500, and 1000Hz. Only the frequency of 2000Hz showed a difference between captures of this potential (p<0.001). p13 and n23 amplitude analysis was also similar in the test–retest for all frequencies analyzed.
Conclusionp13 and n23 latencies and amplitudes of VEMP for tone-burst stimuli at frequencies of 250, 500, and 1000Hz are reproducible.
Ainda não existe consenso quanto ao melhor estímulo acústico utilizado para a captação do potencial evocado miogênico vestibular (PEMV). Respostas amplas são observadas para estímulos de baixa frequência, porém estudos recentes ainda utilizam cliques. A reprodutibilidade dos traçados é um importante parâmetro de análise para observar a confiabilidade das respostas.
ObjetivoVerificar a reprodutibilidade dos parâmetros “latência e amplitude das ondas p13 e n23” do PEMV para estímulos com diferentes frequências de estímulos do tipo tone burst, e definir a melhor frequência de teste.
MétodoEstudo de coorte-transversal. Captou-se PEMV em 156 orelhas, no músculo esternocleidomastóideo, com 100 estímulos do tipo tone burst nas frequências de 250, 500, 1000 e 2000Hz e nível sonoro 95dB NAn, registrados três vezes de cada lado.
ResultadosForam constatadas similaridades para latências de p13 e n23 do potencial estudado nos três momentos com estímulos tone burst em 250, 500, 1000Hz, e diferenças entre as captações desse potencial (P < 0.001) para a frequência de 2000Hz. A análise da amplitude de p13 e n23 se mostrou semelhante, no teste-reteste, para todas as frequências analisadas.
ConclusãoExiste reprodutibilidade das latências e amplitudes de p13 e n23 do PEMV para estímulos tone burst nas frequências de 250, 500 e 1000Hz.
To capture the vestibular evoked myogenic potential (VEMP), sound stimuli of tone-burst type at frequencies between 100 and 3200Hz1–4 or clicks5,6 may be used. In general, tone bursts are more effective than clicks for obtaining VEMP. Among tone-burst stimuli, low frequencies (≤1000Hz) are more effective than high frequencies,7,8 and 500Hz is the most commonly used.2,8,9
There is still no consensus in the literature with regard to the best acoustic stimulus used for VEMP recording. A recent study10 used click stimuli, which stimulate the region of sensitivity with a range 1000–4000Hz. Research shows that high-frequency stimuli result in poor definition of waves p13 and n23, and the appearance of vagueness of tracing.7,8
VEMP waves present reproducibility for circumstances and parameters of controlled stimuli. The reproducibility of the tracing is an important analytical parameter to observe the reliability of responses.11
To date, there are no studies in literature (databases: SciELO, LILACS, Scirus, ScienceDirect, and Scopus) presenting the same methodological design adopted in this study, which aim to determine the reproducibility (test–retest) of the parameter “latency and amplitude of waves p13 and n23” for the VEMP, for stimuli with different tone-burst frequencies, and to define the best test frequency.
MethodsThis was a historical cross-sectional cohort study in accordance with Resolution No. 196/96 of the National Health Council (Conselho Nacional de Saúde). It was submitted to the Research Ethics Committee of the university where the data were collected, and approved under number 1010. The data collection was conducted from March 2010 to March 2012.
Recordings of VEMP were collected from 78 volunteers (156 ears); 40 female and 38 male subjects aged between 18 and 31 years old (21.28±2.90 years). The subjects were selected by the following inclusion criteria: normal hearing thresholds, i.e., ≤20dB nHL, for frequencies between 250 and 8000Hz obtained by pure tone audiometry test; and as to tympanometry, the subjects were required to demonstrate a type A tympanogram.
The following exclusion criteria were adopted: changes in external and/or middle ear; occupational or leisure noise exposure and/or ototoxic medication; presence of tinnitus, vertigo, dizziness, or other cochleovestibular changes; and presence of systemic changes that could contribute to cochleovestibular pathologies, such as diabetes, hypertension, and dyslipidemia and/or hormonal changes.
VEMP tests were performed with a specific apparatus for capture of this potential, developed at the Center for Instrumentation, Dosimetry, and Radiation Protection, Faculdade de Filosofia, Ciências e Letras de Ribeirão Preto, Universidade de São Paulo (USP-FFCLRP),12 which is composed of biological amplifiers, filters, an electrical protection system, and a logic system that enables a detailed investigation of VEMP. This equipment was validated with gold-standard commercial equipment and has been used in previous studies.13–15
The recording was performed using disposable silver- and silver chloride-type (Ag/AgCl) surface electrodes, in which the active electrode was placed on the upper half of the sternocleidomastoid muscle, ipsilateral to stimulation; the reference electrode on the ipsilateral upper edge of the sternum, and the ground electrode on the frontal midline. Impedance among the electrodes up to 3kΩ and of each isolated electrode of 5kΩ was allowed.
To obtain a recording of VEMP in the sternocleidomastoid muscle, the patient remained seated, with maximum lateral rotation of the head to the side contralateral to the stimulus, and maintained a tonic contraction of the muscle around 60–80μV, which was monitored by means of surface electromyography. The stimuli presented through ER-3A insert earphones was introduced in the right afferent and, subsequently, was repeated in the left afferent. The responses were replicated, that is, recorded three times on the right side and three times on the left side. Those tests presenting vagueness of the recording of the waves in the VEMP tracing, due to the presence of noise and artifacts, were excluded.
On examination of VEMP, 100 tone-burst stimuli were averaged at frequencies of 250, 500, 1000, and 2000Hz, with a duration of 10ms (uphill: 4ms, plateau: 2ms, downhill: 4ms), a rate of 5Hz, a sound intensity level of 95dB nHL, and with the use of a band-pass filter of 5–2200Hz. The recordings were performed in 50ms windows.
p13 latency was defined by the positive polarity of a biphasic waveform that appears approximately at 13ms, and n23 latency was defined by a negative polarity of the biphasic waveform that appears at approximately 23ms.
The amplitude of the wave p13 was measured from the zero reference to the most positive peak of the wave on the Cartesian Y-axis. Conversely, the amplitude of wave n23 was measured from the zero reference to the most negative peak of the wave on the Cartesian Y axis. Both waves were measured in microvolts.
PASW Statistics data editor software (version 17.0) was used for data analysis. The Shapiro–Wilk test was applied to test the normality of the sample. Student's t-test was used for independent analysis of wave recordings of VEMP between ears. The analysis of variance (ANOVA) test was used to compare the different recordings of VEMP, for parameters “latency and amplitude of waves p13 and n23”, and Tukey's post hoc test was used for the analysis of VEMP parameters captured by tone bursts of different frequencies. Values were considered significant for p≤0.05 and an alpha value of 0.1 was adopted.
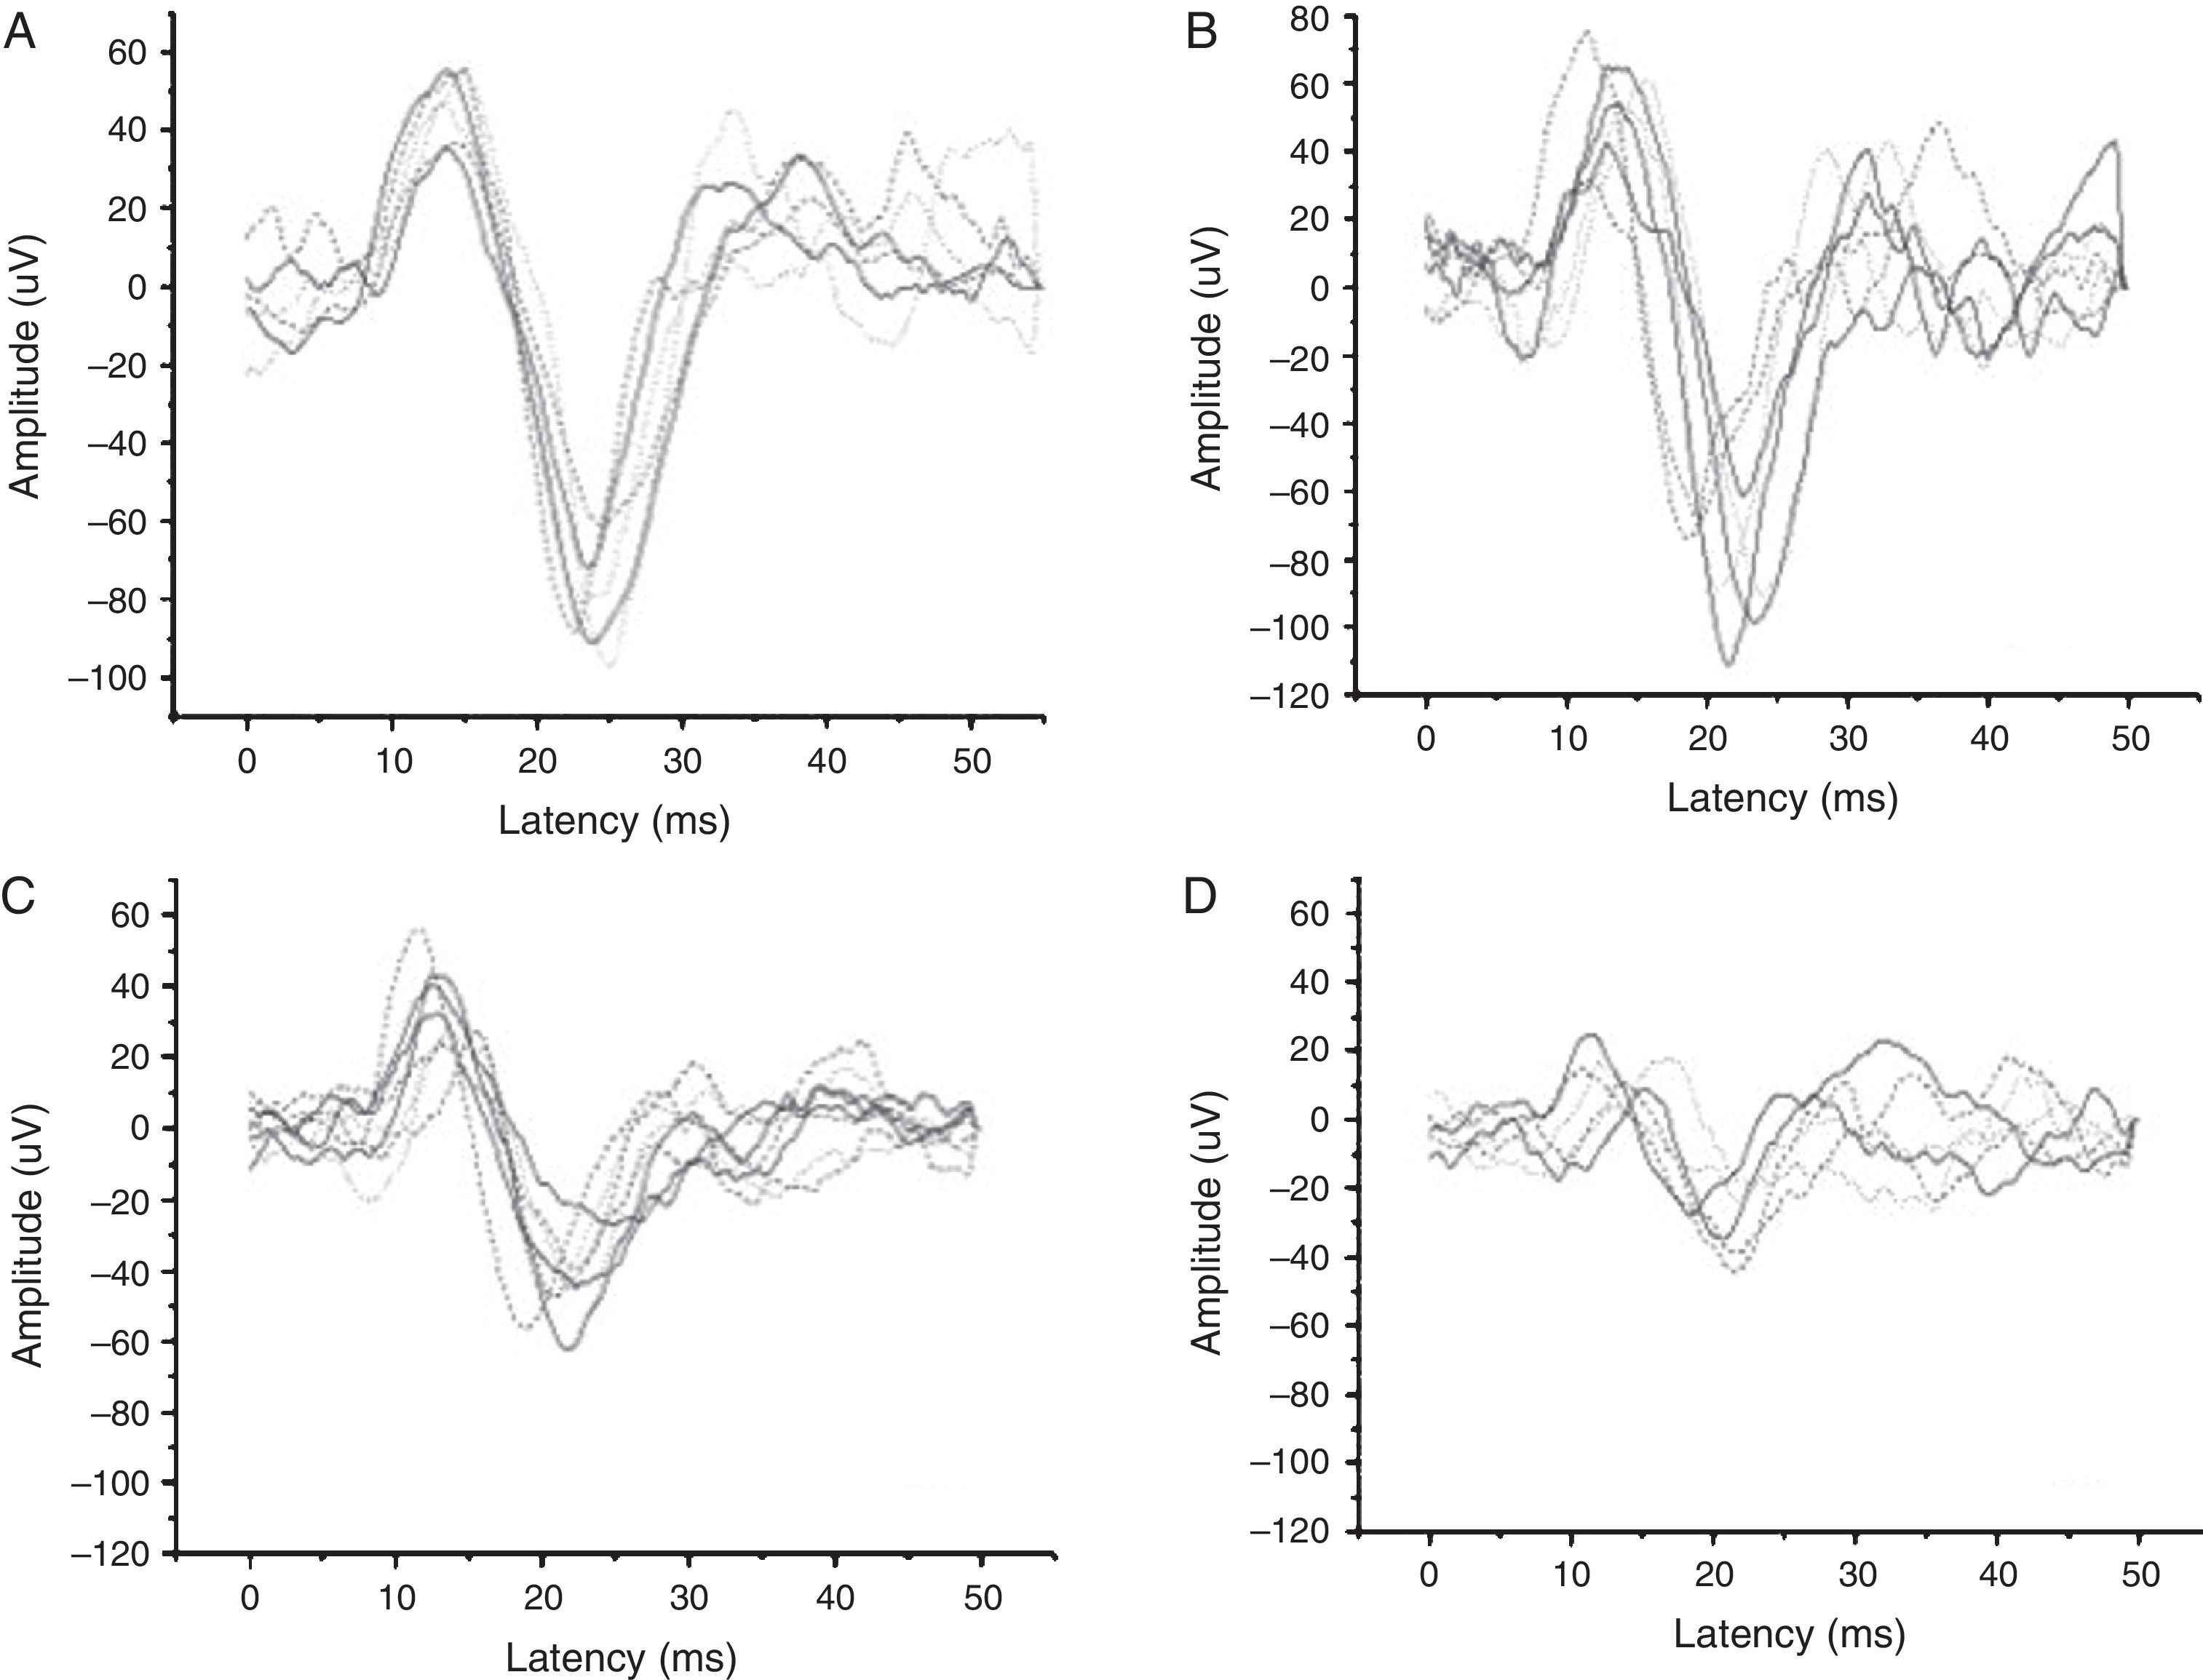
ResultsVEMP was recorded with appropriate morphology and amplitude in all subjects at frequencies of 250Hz and 500Hz, in 97.5% at 1000Hz, and in 87% at 2000Hz. Thus, no definition of VEMP wave tracings was observed in two subjects for the frequency of 1000Hz, and in 10 subjects for 2000Hz, bilaterally.
The recordings of VEMP wave tracings by stimulation frequency are shown in Fig. 1.

With the independent use of Student's t-test, no significant difference was found between right and left ears for latencies and amplitudes of p13 and n23 with tone-burst stimuli of 250, 500, 1000, and 2000Hz, considering p-values ≤ 0.05. Thus, the data are presented without regard to the ear tested.
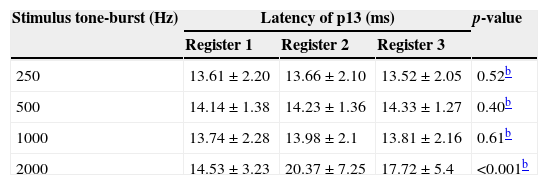
The latencies of p13 for VEMP recording were similar (difference of up to 0.24ms), in the test–retest, for tone-burst (TB) stimuli of 250, 500, and 1000Hz, with no difference for p-values ≤0.05. There was significant difference only for TB-2000Hz (difference equal to 5.84ms), with p<0.001 (Table 1).
Mean values and standard deviation of the register of latency for wave p13 (test–retest) of vestibular evoked myogenic potential recorded by different tone-burst stimuli,a (n=156 for frequencies of 250 and 500Hz, n=152 for 1000Hz, and n=136 for 2000Hz).
| Stimulus tone-burst (Hz) | Latency of p13 (ms) | p-value | ||
|---|---|---|---|---|
| Register 1 | Register 2 | Register 3 | ||
| 250 | 13.61±2.20 | 13.66±2.10 | 13.52±2.05 | 0.52b |
| 500 | 14.14±1.38 | 14.23±1.36 | 14.33±1.27 | 0.40b |
| 1000 | 13.74±2.28 | 13.98±2.1 | 13.81±2.16 | 0.61b |
| 2000 | 14.53±3.23 | 20.37±7.25 | 17.72±5.4 | <0.001b |
ms, milliseconds; Hz, Hertz.
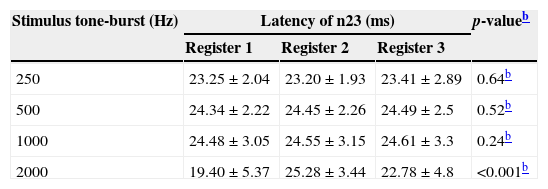
As for n23 latencies, the smallest difference between VEMP recordings in the test–retest was for the TB-stimulus of 1000Hz (0.13ms), followed by TB-500Hz (0.15ms) and TB-250Hz (0.21ms), respectively. Statistically significant differences were found only for the parameter “latency of wave n23”, between recordings, for TB-2000Hz, with a difference equal to 5.88ms and p<0.001 (Table 2).
Mean values and standard deviation of register of latency for wave n23 (test–retest) of vestibular evoked myogenic potential recorded by different tone-burst stimuli,a (n=156 for frequencies of 250 and 500Hz, n=152 for 1000Hz, and n=136 for 2000Hz).
| Stimulus tone-burst (Hz) | Latency of n23 (ms) | p-valueb | ||
|---|---|---|---|---|
| Register 1 | Register 2 | Register 3 | ||
| 250 | 23.25±2.04 | 23.20±1.93 | 23.41±2.89 | 0.64b |
| 500 | 24.34±2.22 | 24.45±2.26 | 24.49±2.5 | 0.52b |
| 1000 | 24.48±3.05 | 24.55±3.15 | 24.61±3.3 | 0.24b |
| 2000 | 19.40±5.37 | 25.28±3.44 | 22.78±4.8 | <0.001b |
ms, milliseconds; Hz, Hertz.
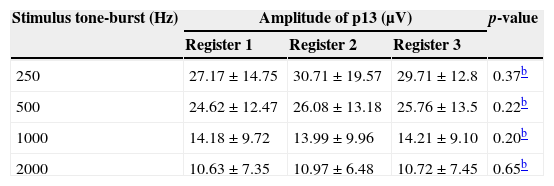
In Table 3, the findings relative to parameter “amplitude of wave p13” are listed. When comparing the three tracings of three different moments of VEMP captures, the differences found (3.54; 1.46; 0.22, and 0.34μV, respectively, for the frequencies of 250, 500, 1000 and 2000Hz) were not statistically significant.
Mean values and standard deviation of the amplitude of wave p13 (test–retest) for vestibular evoked myogenic potential recorded by different tone-burst stimuli,a (n=156 for the frequencies of 250 and 500Hz, n=152 for 1000Hz, and n=136 for 2000Hz).
| Stimulus tone-burst (Hz) | Amplitude of p13 (μV) | p-value | ||
|---|---|---|---|---|
| Register 1 | Register 2 | Register 3 | ||
| 250 | 27.17±14.75 | 30.71±19.57 | 29.71±12.8 | 0.37b |
| 500 | 24.62±12.47 | 26.08±13.18 | 25.76±13.5 | 0.22b |
| 1000 | 14.18±9.72 | 13.99±9.96 | 14.21±9.10 | 0.20b |
| 2000 | 10.63±7.35 | 10.97±6.48 | 10.72±7.45 | 0.65b |
μV, microvolts; Hz, Hertz.
a Data expressed as mean±standard deviation.
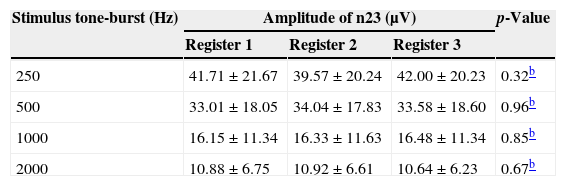
Just as for the amplitude of p13, a similarity for the parameter “amplitude of wave n23” was also observed in the test–retest in all frequencies analyzed, with Δ values up to 2.43μV (Table 4).
Mean values and standard deviation of amplitude of wave n23 (test–retest) of vestibular evoked myogenic potential recorded by different tone-burst stimuli,a (n=156 for frequencies of 250 and 500Hz, n=152 for 1000Hz, and n=136 for 2000Hz).
| Stimulus tone-burst (Hz) | Amplitude of n23 (μV) | p-Value | ||
|---|---|---|---|---|
| Register 1 | Register 2 | Register 3 | ||
| 250 | 41.71±21.67 | 39.57±20.24 | 42.00±20.23 | 0.32b |
| 500 | 33.01±18.05 | 34.04±17.83 | 33.58±18.60 | 0.96b |
| 1000 | 16.15±11.34 | 16.33±11.63 | 16.48±11.34 | 0.85b |
| 2000 | 10.88±6.75 | 10.92±6.61 | 10.64±6.23 | 0.67b |
μV, microvolts; Hz, Hertz.
Comparing the stimuli frequencies used for recording VEMP with the use of Tukey's post hoc test, significant differences were only found for p13 and p23 latencies between frequencies of 250 and 2000Hz, with p<0.04 and p<0.001, respectively.
In the analysis of amplitudes, it was observed that the wave p13 had a different presentation, when comparing the frequencies of 250 and 500Hz with stimuli at 1000 and 2000Hz (p<0.001), as well as between 1000 and 2000Hz (p=0.04). In the wave n23, this parameter was different at all frequencies of stimulation for values of p<0.005. Thus, it is noted that, on average, stimuli with lower frequencies provide a recording of VEMP responses with larger amplitudes.
DiscussionAnalyzing these VEMP results, it was found that the lack of responses was restricted to tone-bursts of 1000 (2.5%) and 2000Hz (13%). Thus, considering that all subjects had no hearing and/or vestibular changes, it can be seen that there is greater saccular sensitivity to lower frequencies,14–17 and that VEMPs captured with stimuli of higher frequencies may not show clear results, resulting in vagueness for waves p13 and n23.3
It is known that the latency does not depend on stimulus intensity, level of electromyographic voltage, and age, and also has high reproducibility.1,18 Thus, the latencies of waves p13 and n23 are important clinical parameters and should be considered in the analysis of VEMP responses, which should be thought of as based on normal values.2,18 Thus, as there is no interference from other factors (besides the type of stimulus), it can be presumed, in the latency analysis, that the differences found between VEMP captures (test–retest) are derived solely from the stimulus used.
Although research shows saccular sensitivity in the region of frequencies between 100 and 3200Hz,3 low frequencies should be used during VEMP recording,3,13–17 since, besides having more defined waves, the present study showed presence of reproducibility for frequencies ≤1000Hz.
The parameter “amplitude”, important in the analysis of VEMP waves, is dependent on many factors, including: stimulus type and level of electromyographic voltage. The present data demonstrate that stimuli with lower frequencies (250 and 500Hz) show, on average, potentials with higher amplitudes, when compared to responses at stimuli with frequencies of 1000 and 2000Hz. This finding was also confirmed by previous studies.9
As the amplitude suffers interference of the variable “muscle tension”, the state of contraction of these muscles was monitored.7,8 This may explain the absence of a statistically significant difference between the test–retest for the amplitudes of p13 and n23 (for all frequencies used). This finding reinforces the principle that the parameter “amplitude” remains constant for recordings in the same subject at different times, when all parameters of stimulation and capture are controlled.
A recent study19 determined the frequency of 500Hz as the stimulus parameter that should be used clinically for VEMP response recording. In the present study, it was observed that the frequencies of 250 and 500Hz are stimuli that provide responses with larger amplitudes and lower latencies than the frequencies of 1000 and 2000Hz. It was also found that the parameter “amplitude of wave n23” was different among frequencies, with highest mean values for 250Hz. This can be explained by the graviceptive characteristics of the sensorial organ responsible for this response (saccule).3,14,15,17,20
ConclusionReproducibility was observed for p13 and n23 latencies of VEMP to tone-burst stimuli at frequencies of 250, 500, and 1000Hz. However, no reproducibility of tracings for stimuli at 2000Hz was observed. The parameter “amplitude” showed reproducibility for all frequencies analyzed. Thus, stimuli of 250, 500, and 1000Hz can be used for clinical recording of VEMP; however, the frequency of 250Hz proved to be the most suitable, as it provides the largest amplitude values for wave n23.
Conflicts of interestThe authors declare no conflicts of interest.
Please cite this article as: de Oliveira AC, Menezes PL, Pereira LD. Reproducibility (test–retest) of vestibular evoked myogenic potential. Braz J Otorhinolaryngol. 2015;81:264–9.
Institution: Universidade Federal de Sergipe, Aracaju, Sergipe, SE, Brazil/Universidade Federal de São Paulo, São Paulo, SP, Brazil.
gology is pleased to honor the reviewers


