

The vestibulocochlear nerve schwannoma (VS) is a benign tumor that stems from the edge of the Schwann's sheath. It is considered the most frequent intracranial benign tumor, of low lethality rate and unknown etiology.
Aimto identify risk factors associated with VS.
Study designsystematic review.
Methodselectronic search of studies using the following key words: “risk”, “schwannoma”, “vestibular”, “neuroma” and “acoustic”. All original articles on epidemiological studies published in Portuguese, English or Spanish describing measures of association were included.
Resultstwenty case-control studies were found, most of them published in the United States. The analysis of those studies shows educational level, household income, occupation, exposure to ionizing radiation and noise, allergic diseases as well as the use of both cellular and cordless phones as risk factors for the VS.
Conclusionmethodological limitations and lack of precision in the findings impose limits to definitive conclusions concerning those risk factors. The current study contributes with information which can subsidize decisions related to the methodology to be used, having in mind new investigations on risk factors for VS. Therefore, it is of great help for knowledge improvement in this field.
The vestibular nerve schwannoma (VS) is a benign tumor that stems from the Schwann's sheath of one of the vestibular nerves. It is considered the most frequent among intracranial benign tumors - representing 90% of the ponto-cerebelar angle tumors and from 8 to 10% of all the cranial tumors. It is unilateral in about 95% of the cases. Bilateral cases are usually associated with type II neurofibromatosis1–5. In most of the cases, this tumor starts between 20 and 60 years of age. It is not associated to any specific race1,4,5 and it is more common in women at a 3:2 ratio. However, its unilateral manifestation seems to be more common in men6.
The world incidence rate varies from one to 20 for every 1,000,000 inhabitants per year. In the United States1,3 and Demark7 the estimate is of ten cases per 1,000,000 inhabitants/year. In Brazil there are no estimates of its incidence. Nonetheless, considering these statistics, we believe there are 1,700 new cases per year to be diagnosed. Nonetheless, this figure could be larger, because these numbers are related only to symptomatic cases4.
Although it is not a malignant tumor and bears low lethality, suspicion and diagnostic investigation happen only when the first signs and symptoms appear. Nonetheless, even with early diagnosis, the surgical excision of the VS can leave sequelae, such as profound hearing loss and facial paralysis1,3,4.
The VS etiology is still obscure. Apparently, the only cause established is a defect on the NF-2 gene of the chromosome 22 long arm, responsible for producing the schwannonian protein, which regulates Schwann cell division4. Such defect can be seen in patients with type II neurofibromatosis; however it is still not proven in patients with unilateral VS.
Currently, different factors associated with brain tumors have been investigated as possible causes for VS. Studies aimed at identifying factors associated to VS development represent a recent task and there are no reports of investigations carried out in Brazil. Thus, the goal of this systematic review is to discuss the main epidemiological findings which analyze the association between the many risk factors and VS.
MATERIALS AND METHODSThis is a systematic review study on the risk factors associated with VS. Our study object was the scientific papers present in electronic data banks of indexed journals. To search for the papers we used the following electronic data bases: Cohrane, Latin-American and Caribbean Literature in Health Sciences (LILACS), National Library of Medicine (MEDLINE) and SciELO, through the website: http://www.bireme.br/php/index.php. We used the following keywords combination “risk”, “schwannoma”, “vestibular”, “neuroma” and “acoustic”, in the abstracts to identify the papers. After that stage, all the abstracts located were read and we selected the papers according to the inclusion and exclusion criteria defined for the study.
We included only original epidemiology research papers published in Portuguese, Spanish or English, from 1966 to November of 2006, which investigated risk factors associated with VS, and which reported some measure of association. All the literature review papers, case reports or even letters to the editor and editorials as well as the papers which described diagnostic procedure, surgical technique and post-op complications were taken off our review. The epidemiological study papers which investigated risk factors for brain tumors and which presented results for VS grouped with another type of tumor were also taken off.
For each one of the papers selected, we carried out a description of the study outline following a guideline including study place, period, design and bases, population, origin, criteria for sample selection, risk factor investigated and exposure check. We also analyzed the methodological aspects in order to discuss those associated with validity, power and biases. For that, we also checked sample size, age range of the participants, participation response rate, use of substitute respondents, study variables and confounding variables control. This assessment was carried out without the help of the models already described in the literature, because after checking the aspects to be evaluated in this study, we observed that the proposals published are more adequate for the analysis of clinical trials. The results from the studies we selected, which investigated the same risk factor for VS, were grouped and thus the minimum and maximum values of the association measures and confidence intervals were presented. For that, when the study variables were stratified in a different way, it was necessary to create new analysis strata. Finally, the results obtained from these investigations were described and analyzed by means of measures of association and confidence intervals.
RESULTSWe found 265 papers, from which we selected 20. The main reasons to exclude papers were discussions of surgical techniques (34%), literature reviews (13.9%) and case reports (12.7%).
All the studies analyzed were case-control type, 11 of hospital basis and nine of populational basis. Inskip et al.'s study8, hospital-based multicentric case-controlled supported the development of nine other studies (Brenner et al.9; De Roos et al.10; Inskip et al.11; Inskip et al.12; Rajaraman et al.13; Hill et al.14; Kleinerman et al.15; Rajamaran et al.16; De Roos, et al.17). Lönn et al.'s study18, populational-based case controlled, provided one more investigation regarding risk factors for VS (Edwards et al.19) (Tables 1 and 2).
Methodological characteristics of the studies which analyzed risk factors associated with vestibular nerve schwannoma
| Reference | Study period and place | Study population | Risk factor investigated | Exposure check | Confounding variables control | Comments |
|---|---|---|---|---|---|---|
| 1 Preston-Martin et al.,1989 | USA 1978-1985 | Los Angeles male residents | Dental x-ray and occupational noise | Questionnaire deployed to the case/ control pair by one interviewer only | 1. Race 2. Year of birth 3. Weekly expo sure to benzene | Objective measure of noise exposure; information related to ionizing radiation exposure (dental x-ray) were validated by comparison with dental records; a reduced number of individuals to analyze head injury and exposure to chemical products; interviewers were not blinded as to the case or control situation. |
| 2 Rodvall et al.,1998 | Sweden 1987-1990 | Individuals with age between 25 and 74 years, who lived near the Upsala University Hospital | X-rays and dental capping | Questionnaire sent to the participants; dental records | 1. Gender 2. Year of birth 3. Parish 4. Dental pros thesis | Small sample; excluding substitute respondents; data from dental x-rays before 25 years were scatter and not analyzed; radiation dose was not estimated; quality of exposure data is questionable. |
| 3 Inskip et al., 2001 | USA 1994-1998 | Individuals with age equal to or higher than 18 years of age admitted to three reference centers for nervous system tumors (Phoenix, Boston and Pittsburgh) and who understood Spanish and English | Cell phone | Questionnaire personally deployed in the hospitals | 1. Hospital 2. Age 3. Gender 4. Race 5. Proximity be tween the house and the hospital | Cases older than controls; the long time of cell phone use was not evaluated; technology of cell phone used was not investigated. |
| 4 Muscat et al., 2002 | USA 1997-1999 | Individuals with age equal to or higher than 18 years | Cell phone | Questionnaire personally deployed in the hospitals | 1. Age 2. Gender 3. Race 4. Hospital 5. Education 6. Occupation 7. Interview mon th and year | This study was carried out one decade after the cell phone was introduced; long time of cell phone use was not evaluated; hearing loss associated with the vestibular nerve schwannoma can impact responses in relation to the side which the cell phone is used. |
| 5 Brenner et al., 2002 | USA 1994-1998 | Individuals with ages equal to our higher than 18 years, admitted to three reference centers for nervous system tumors (Phoenix, Boston and Pittsburgh) and who understood English or Spanish | Past of allergic or autoimmune disorders | Questionnaire personally deployed in the hospitals | 1. Hospital 2. Age 3. Gender 4. Race 5. Proximity between hospital and household | Interviewers were not blind towards the case or control condition; self-reported allergy -except for hay fever; data were not collected in relation to the treatment carried out for the disorders investigated; |
| 6 Hardell et al., 2003 | Sweden 1997-2000 | Individuals with ages between 20 and 80 years, of both genders, residing in four medical regions in Sweden | Cell phone and wireless phone | Personally deployed questionnaire | 1. Gender 2. Age 3. Geographic location | Inclusion of cases with histopathology confirmation; long time of cell phone use was not assessed; interviewers were blind as to the case and control condition. |
| 7 Roos et al., 2003 | EUA 1994-1998 | Individuals with ages equal to or above 18 years admitted to three reference centers for nervous system tumors (Phoenix, Boston and Pittsburgh) and who understood English or Spanish | Chemical substances | Questionnaire personally deployed in hospitals and blood sample collection for DNA analysis | 1. Hospital 2. Age 3. Gender 4. Race 5. Proximity between hospital and household | The variants of the genes evaluated may also be associated with the disorders of the hospital controls. |
| 8 Inskip et al., 2003a | USA 1994-1998 | Individuals with age equal to or higher than 18 years admitted to three nervous system tumor reference centers (Phoenix, Boston and Pittsburgh) and who understood English or Spanish | Laterality | Questionnaire personally deployed in the hospitals | 1. Education 2. Marital status | The digit-manual laterality can be influenced by socio-cultural factors. |
| 9Inskip et al., 2003b | USA 1994-1998 | Individuals of 18 years of age or higher, admitted to three nervous system tumor reference centers (Phoenix, Boston and Pittsburgh) and who understood English or Spanish | Socio-de-mographic metrics | Questionnaire personally deployed in the hospitals | 1. Hospital 2. Age 3. Gender 4. Race 5. Proximity between hospital and household | Inclusion of incidental and histologically confirmed cases; low rate of substitute respondents; hospital controls; education and socio-economical status can impact the perception of signs and symptoms and favor access to diagnosis. |
| 10 Chris-tensen et al., 2004 | Denmark 2000-2002 | Individuals with ages between 20 and 69 years. | Cell phone | Personally deployed questionnaire | 1. Age 2. Gender 3. Education 4. Region 5. Marital status 6. Earphones use | Personal interviews; time used to answer the questionnaire was similar for cases and controls; the time of cell phone used was not estimated according to the technology. |
| 11 Rajara-man et al., 2004 | USA 1994-1998 | Individuals of 18 years of age or higher, admitted to three nervous system tumor reference centers (Phoenix, Boston and Pittsburgh) and who understood English or Spanish | Occupation | Questionnaire personally deployed in hospitals | 1. Hospital 2. Aged 3. Gender 4. Race 5. Proximity between hospital and household | Hospital controls; individuals distributed throughout 121 occupational groups; reduced number of individuals by occupational group. |
| 12 Lönn et al., 2004 | Sweden 1999-2002 | Individuals with ages between 20 and 69 years, residents in three regions within the scope of the Regional Cancer Register (Stockholm, Göteborg and Lund) | Cell phone | Questionnaire personally deployed or by phone or filled out by the very individual | 1. Age 2. Gender 3. Residential area 4. Education | Greater rate of participation of cases; a long time of cell phone use was not assessed. |
| 13 Hill et al., 2004 | USA 1994-1998 | Individuals of 18 years of age or higher, admitted to three nervous system tumor reference centers (Phoenix, Boston and Pittsburgh) and who understood English or Spanish | Family history of cancer | Questionnaire personally deployed in the hospitals | 1. Gender 2. Age 3. Race 4. Proximity between hospital and household | Reduced number of observations in the extracts; it was not confirmed whether or not the reported cases of cancer in the family were true; trained interviewers; interview carried out at the most of three weeks after the diagnosis of the cases. |
| 14 Scho-emaker et al., 2005 | Great Britain 1999-2004 | Individuals residing in the areas of study scope | Cell phone | Questionnaire deployed personally or by telephone | 1. Age 2. Gender 3. Region | Possible selection bias because of a higher rate of participation of the cases; hearing loss associated with vestibu-lar nerve schwannoma can influence responses associated with the use of cell phones; individuals who used the cell phone ipsilaterally to the tumor can have an early diagnosis because of a reduced hearing acuity. |
| 15 Hardell et al., 2005 | Sweden 2000-2003 | Individuals aged between 20 and 80 years, of both genders, residing in the four medical regions of Sweden | Cell phone and wireless phone | Questionnaire deployed personally or by phone | 1. Age 2. Gender 3. Socioecono- mic status 4. year of diag nosis | Interviewers were blind to the case and control condition; a greater number of cases with long time of cell phone use in relation to the other studies. |
| 16 Kleiner-man et al., 2005 | EUA 1994-1998 | Individuals of 18 years of age or higher, admitted to three nervous system tumor reference centers (Phoenix, Boston and Pittsburgh) and who understood English or Spanish | Electromagnetic waves coming from household appliances | Questionnaire deployed personally in hospitals | 1. Age 2. Gender 3. Race 4. Proximity between hospital and household | Questionnaire deployed may have not been proper to assess exposure and may have caused a classification error; incomplete questionnaire data; half of the cases and one fourth of the controls needed help to answer the questionnaire; the interruption in device use was not investigated. |
| 17 Edwards et al., 2005 | Sweden 1999-2002 | Individuals with ages between 20 and 69 years, residents in three regions within the scope of the Regional Cancer Register (Stockholm, Göteborg and Lund) | Occupational and non-occupational noise | Questionnaire made by phone or personally or filled out by the individual him/herself | 1. Age 2. Gender 3. Residential area 4. Education 5. Ionizing radiation 6. Cell phone | Greater participation of cases when compared to controls; interviewers not being blind regarding the status of case or control; noise exposure check was not validated by the work/occupation history. |
| 18 Rajama-ran et al., 2005 | USA 1994-1998 | Individuals of 18 years of age or higher, admitted to three nervous system tumor reference centers (Phoenix, Boston and Pittsburgh) and who understood English or Spanish | Chemicals | Questionnaire personally deployed in the hospitals and blood sample collection for DNA analysis; | 1. Hospital 2. Age 3. Gender 4. Race 5. Proximity between hospital and residence | We took off the controls who had disorders that could be associated with the variants of the investigated gene. |
| 19 Forssén et al., 2006 | Sweden 1987-1999 | Workers residing in Sweden | Occupational exposure to electromagnetic waves | Questionnaire; cense data/ previously built occupational exposure matrix | 1. Gender 2. Age | Large sample and good statistical power; randomly selected controls. |
| 20 Roos et al., 2006 | USA 1994-1998 | Individuals of 18 years of age or higher, admitted to three nervous system tumor reference centers (Phoenix, Boston and Pittsburgh) and who understood English or Spanish | Chemicals | Questionnaire personally deployed in hospitals and blood sample collection for DNA analysis | 1. Hospital 2. Age 3. Gender 4. Race 5. Proximity between hospital and household | High rate of participation among cases and controls. |
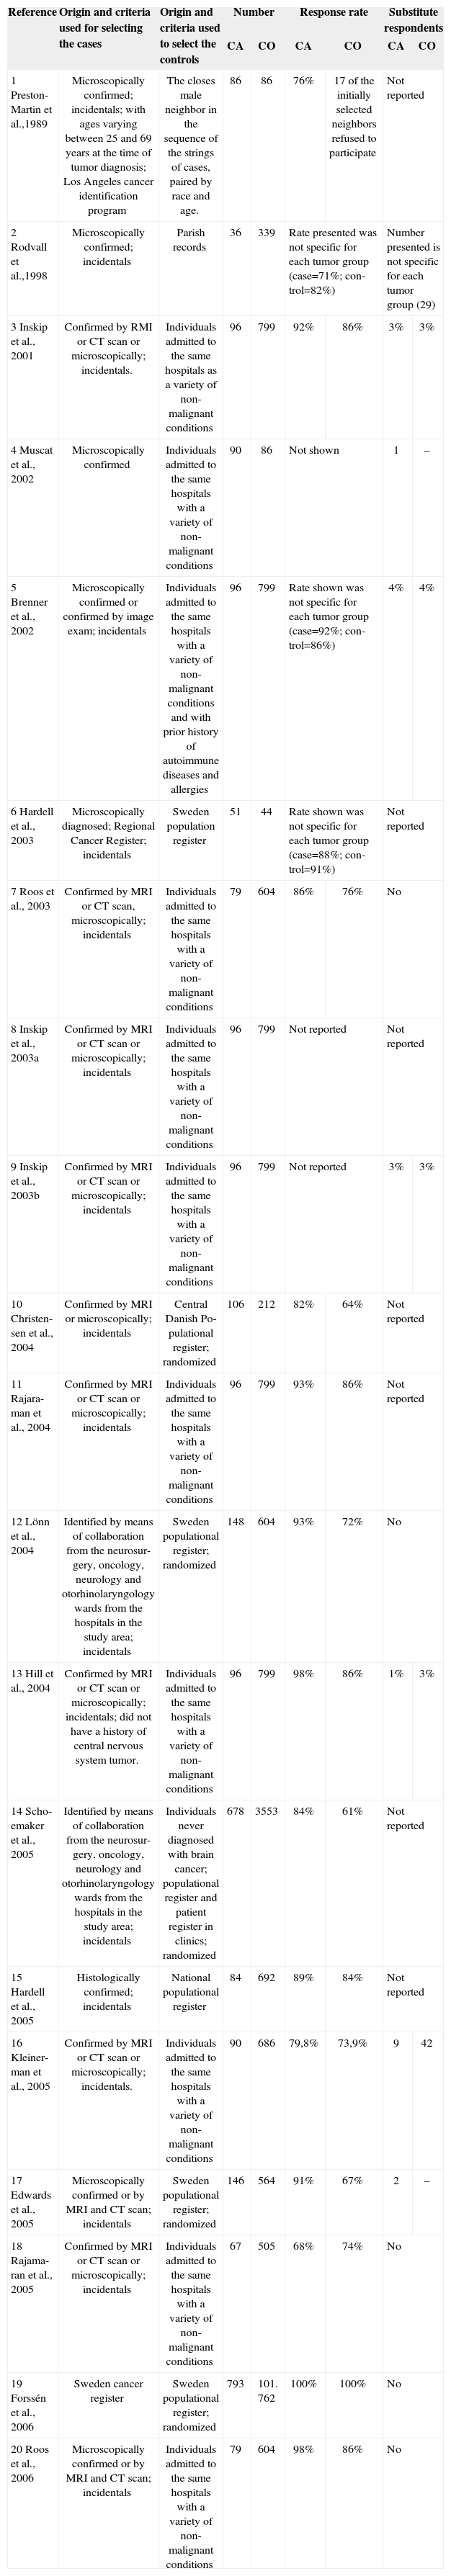
Characteristics of the cases and controls from the studies which investigated risk factors associated with vestibular nerve schwanno-ma
| Reference | Origin and criteria used for selecting the cases | Origin and criteria used to select the controls | Number | Response rate | Substitute respondents | |||
|---|---|---|---|---|---|---|---|---|
| CA | CO | CA | CO | CA | CO | |||
| 1 Preston-Martin et al.,1989 | Microscopically confirmed; incidentals; with ages varying between 25 and 69 years at the time of tumor diagnosis; Los Angeles cancer identification program | The closes male neighbor in the sequence of the strings of cases, paired by race and age. | 86 | 86 | 76% | 17 of the initially selected neighbors refused to participate | Not reported | |
| 2 Rodvall et al.,1998 | Microscopically confirmed; incidentals | Parish records | 36 | 339 | Rate presented was not specific for each tumor group (case=71%; con-trol=82%) | Number presented is not specific for each tumor group (29) | ||
| 3 Inskip et al., 2001 | Confirmed by RMI or CT scan or microscopically; incidentals. | Individuals admitted to the same hospitals as a variety of non-malignant conditions | 96 | 799 | 92% | 86% | 3% | 3% |
| 4 Muscat et al., 2002 | Microscopically confirmed | Individuals admitted to the same hospitals with a variety of non-malignant conditions | 90 | 86 | Not shown | 1 | – | |
| 5 Brenner et al., 2002 | Microscopically confirmed or confirmed by image exam; incidentals | Individuals admitted to the same hospitals with a variety of non-malignant conditions and with prior history of autoimmune diseases and allergies | 96 | 799 | Rate shown was not specific for each tumor group (case=92%; con-trol=86%) | 4% | 4% | |
| 6 Hardell et al., 2003 | Microscopically diagnosed; Regional Cancer Register; incidentals | Sweden population register | 51 | 44 | Rate shown was not specific for each tumor group (case=88%; con-trol=91%) | Not reported | ||
| 7 Roos et al., 2003 | Confirmed by MRI or CT scan, microscopically; incidentals | Individuals admitted to the same hospitals with a variety of non-malignant conditions | 79 | 604 | 86% | 76% | No | |
| 8 Inskip et al., 2003a | Confirmed by MRI or CT scan or microscopically; incidentals | Individuals admitted to the same hospitals with a variety of non-malignant conditions | 96 | 799 | Not reported | Not reported | ||
| 9 Inskip et al., 2003b | Confirmed by MRI or CT scan or microscopically; incidentals | Individuals admitted to the same hospitals with a variety of non-malignant conditions | 96 | 799 | Not reported | 3% | 3% | |
| 10 Christen-sen et al., 2004 | Confirmed by MRI or microscopically; incidentals | Central Danish Po-pulational register; randomized | 106 | 212 | 82% | 64% | Not reported | |
| 11 Rajara-man et al., 2004 | Confirmed by MRI or CT scan or microscopically; incidentals | Individuals admitted to the same hospitals with a variety of non-malignant conditions | 96 | 799 | 93% | 86% | Not reported | |
| 12 Lönn et al., 2004 | Identified by means of collaboration from the neurosur-gery, oncology, neurology and otorhinolaryngology wards from the hospitals in the study area; incidentals | Sweden populational register; randomized | 148 | 604 | 93% | 72% | No | |
| 13 Hill et al., 2004 | Confirmed by MRI or CT scan or microscopically; incidentals; did not have a history of central nervous system tumor. | Individuals admitted to the same hospitals with a variety of non-malignant conditions | 96 | 799 | 98% | 86% | 1% | 3% |
| 14 Scho-emaker et al., 2005 | Identified by means of collaboration from the neurosur-gery, oncology, neurology and otorhinolaryngology wards from the hospitals in the study area; incidentals | Individuals never diagnosed with brain cancer; populational register and patient register in clinics; randomized | 678 | 3553 | 84% | 61% | Not reported | |
| 15 Hardell et al., 2005 | Histologically confirmed; incidentals | National populational register | 84 | 692 | 89% | 84% | Not reported | |
| 16 Kleiner-man et al., 2005 | Confirmed by MRI or CT scan or microscopically; incidentals. | Individuals admitted to the same hospitals with a variety of non-malignant conditions | 90 | 686 | 79,8% | 73,9% | 9 | 42 |
| 17 Edwards et al., 2005 | Microscopically confirmed or by MRI and CT scan; incidentals | Sweden populational register; randomized | 146 | 564 | 91% | 67% | 2 | – |
| 18 Rajama-ran et al., 2005 | Confirmed by MRI or CT scan or microscopically; incidentals | Individuals admitted to the same hospitals with a variety of non-malignant conditions | 67 | 505 | 68% | 74% | No | |
| 19 Forssén et al., 2006 | Sweden cancer register | Sweden populational register; randomized | 793 | 101. 762 | 100% | 100% | No | |
| 20 Roos et al., 2006 | Microscopically confirmed or by MRI and CT scan; incidentals | Individuals admitted to the same hospitals with a variety of non-malignant conditions | 79 | 604 | 98% | 86% | No | |
MRI: Magnetic resonance image
CA: cases
CO: controls
The first paper included in the present review was published in 1989 and most of the others (75%) were published after 2003. The United States contributed with 12 papers, Sweden with six, Denmark and Great Britain published one each.
Eighteen studies included only incidental cases. Muscat et al.20 and Forséen et al.21 did not report this information. Most of the studies (80%) described that VS was confirmed histologically or though an image exam. In two papers (Lönn et al.18; Schoemaker et al.22), there is only the information that the cases were diagnosed or identified through he health care facilities and in one of the reports (Forséen et al.21) the cases were recruited with the support from the national cancer register.
In seven populational-base studies, control selection happened through the use of data coming from the populational register and in one of these they also used additional data from medical clinics. In the study led by Rodvall et al.23, the parish register was used to select the controls, and in the study carried out by Preston-Martin et al.24 the neighbors of the cases participated in the sample. Of all the populational-base studies, only five described that the controls were randomly selected. For all the hospital-base studies we observed that the individuals who made up the control group were submitted to the same hospitals of the cases with a variety of non-malignant conditions.
In two studies, it was noticed that the exposure checking was not restricted to the information provided by the interviewed individuals. Preston-Martin et al.24 validated the information obtained in relation to dental x-ray exposure by comparison with dental records. Now, as far as occupational noise is concerned, the same authors only considered exposed those individuals who reported occupations listed in the national survey of occupational risk in the USA (NOHS) as those in occupations which involve exposure to high levels of sound pressure. In the study carried out by Rajamaran et al.13, in which the occupation was analyzed as a risk factor for VS, the 121 occupational groups created were based on manuals which classified and coded occupations in the country.
The minimum number of participants was 36 and the maximum was 793 for the cases; and 44 and 101,762 for the controls, respectively. In most of the studies, the mean ages of cases and controls were similar, usually varying between 20 and 70 years of age. The low participation rate among the cases was observed in the study carried out by Rajamarn et al.16 (68%) and the study by Schoemaker et al.22 which had the lowest response rate among controls (61%). In the remaining studies, this rate varied between 76% to 98% (cases) and between 64% and 86% (controls).
In three studies we noticed a lower participation of the control group individuals, creating a difference of participating individuals above 20% when compared to the cases18,19,22 and in three other studies, the participation rate of the VS cases was presented together with that of other types of tumors9,23,25. Substitute respondents were interviewed in eight studies8,9,12-15,19,23 and in four of them the participation reached a maximum value of 4%, and similar among case and control groups8,9,12,14. All the studies controlled confounding variables, and gender and age variables were tested in all of them.
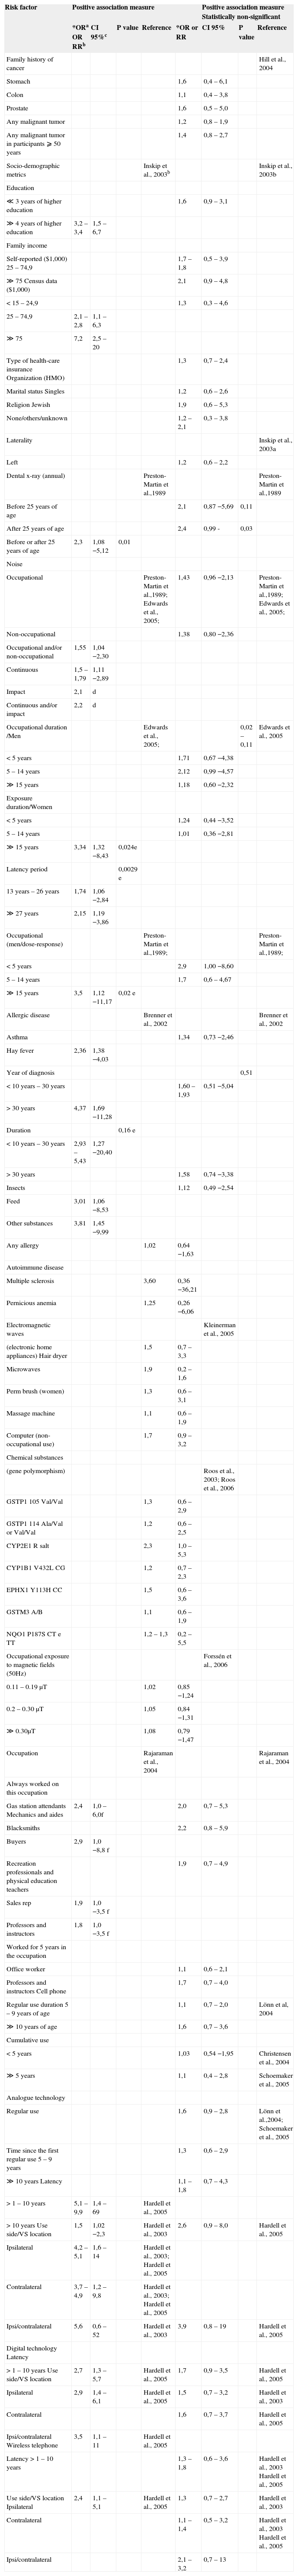
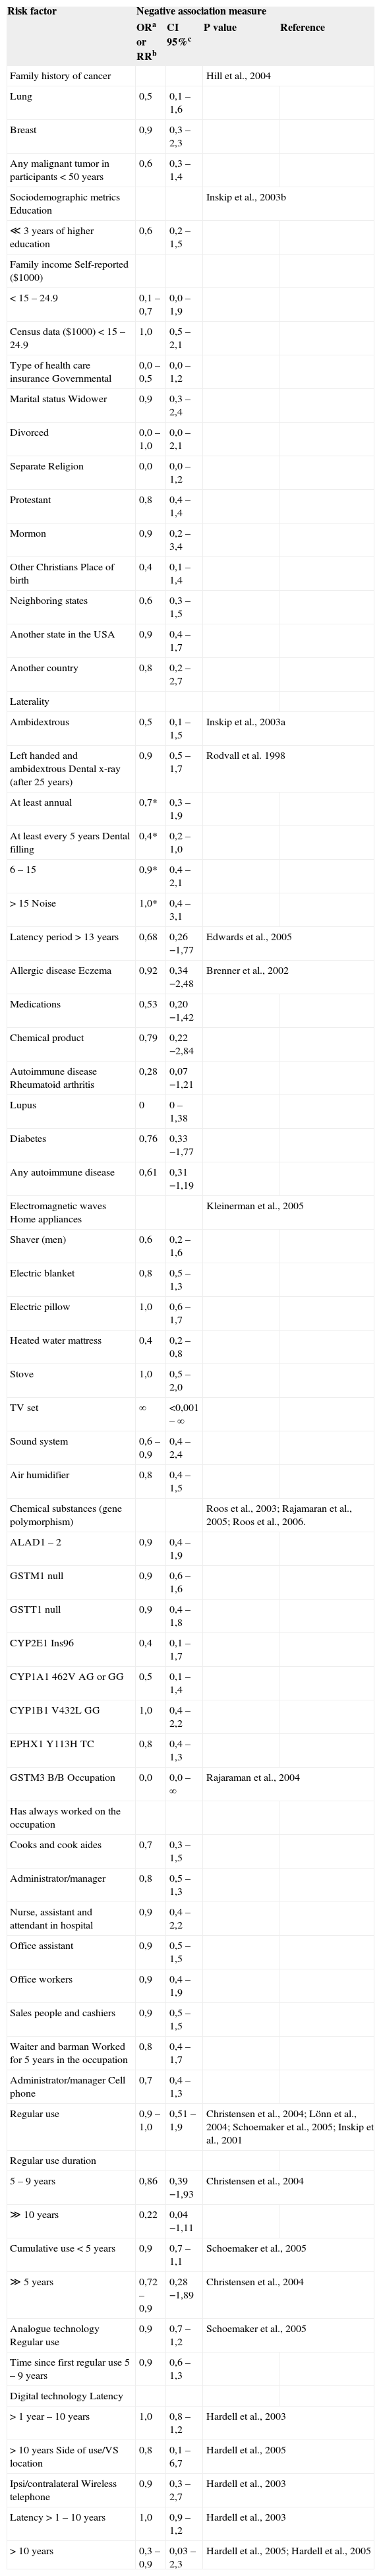
Tables 3 and 4 show the positive and negative associations among many variables and the VS respectively. Among the variables which revealed a negative association, only one (heated water mattress) was statistically significant.
Positive associations found in the studies which assessed the risk factors for schwannoma and vestibular nerve.
| Risk factor | Positive association measure | Positive association measure Statistically non-significant | ||||||
|---|---|---|---|---|---|---|---|---|
| *ORa OR RRb | CI 95%c | P value | Reference | *OR or RR | CI 95% | P value | Reference | |
| Family history of cancer | Hill et al., 2004 | |||||||
| Stomach | 1,6 | 0,4 – 6,1 | ||||||
| Colon | 1,1 | 0,4 – 3,8 | ||||||
| Prostate | 1,6 | 0,5 – 5,0 | ||||||
| Any malignant tumor | 1,2 | 0,8 – 1,9 | ||||||
| Any malignant tumor in participants ⩾ 50 years | 1,4 | 0,8 – 2,7 | ||||||
| Socio-demographic metrics | Inskip et al., 2003b | Inskip et al., 2003b | ||||||
| Education | ||||||||
| ≪ 3 years of higher education | 1,6 | 0,9 – 3,1 | ||||||
| ≫ 4 years of higher education | 3,2 – 3,4 | 1,5 – 6,7 | ||||||
| Family income | ||||||||
| Self-reported ($1,000) 25 – 74,9 | 1,7 – 1,8 | 0,5 – 3,9 | ||||||
| ≫ 75 Census data ($1,000) | 2,1 | 0,9 – 4,8 | ||||||
| < 15 – 24,9 | 1,3 | 0,3 – 4,6 | ||||||
| 25 – 74,9 | 2,1 – 2,8 | 1,1 – 6,3 | ||||||
| ≫ 75 | 7,2 | 2,5 – 20 | ||||||
| Type of health-care insurance Organization (HMO) | 1,3 | 0,7 – 2,4 | ||||||
| Marital status Singles | 1,2 | 0,6 – 2,6 | ||||||
| Religion Jewish | 1,9 | 0,6 – 5,3 | ||||||
| None/others/unknown | 1,2 – 2,1 | 0,3 – 3,8 | ||||||
| Laterality | Inskip et al., 2003a | |||||||
| Left | 1,2 | 0,6 – 2,2 | ||||||
| Dental x-ray (annual) | Preston-Martin et al.,1989 | Preston-Martin et al.,1989 | ||||||
| Before 25 years of age | 2,1 | 0,87 −5,69 | 0,11 | |||||
| After 25 years of age | 2,4 | 0,99 - | 0,03 | |||||
| Before or after 25 years of age | 2,3 | 1,08 −5,12 | 0,01 | |||||
| Noise | ||||||||
| Occupational | Preston-Martin et al.,1989; Edwards et al., 2005; | 1,43 | 0,96 −2,13 | Preston-Martin et al.,1989; Edwards et al., 2005; | ||||
| Non-occupational | 1,38 | 0,80 −2,36 | ||||||
| Occupational and/or non-occupational | 1,55 | 1,04 −2,30 | ||||||
| Continuous | 1,5 – 1,79 | 1,11 −2,89 | ||||||
| Impact | 2,1 | d | ||||||
| Continuous and/or impact | 2,2 | d | ||||||
| Occupational duration /Men | Edwards et al., 2005; | 0,02 – 0,11 | Edwards et al., 2005 | |||||
| < 5 years | 1,71 | 0,67 −4,38 | ||||||
| 5 – 14 years | 2,12 | 0,99 −4,57 | ||||||
| ≫ 15 years | 1,18 | 0,60 −2,32 | ||||||
| Exposure duration/Women | ||||||||
| < 5 years | 1,24 | 0,44 −3,52 | ||||||
| 5 – 14 years | 1,01 | 0,36 −2,81 | ||||||
| ≫ 15 years | 3,34 | 1,32 −8,43 | 0,024e | |||||
| Latency period | 0,0029 e | |||||||
| 13 years – 26 years | 1,74 | 1,06 −2,84 | ||||||
| ≫ 27 years | 2,15 | 1,19 −3,86 | ||||||
| Occupational (men/dose-response) | Preston-Martin et al.,1989; | Preston-Martin et al.,1989; | ||||||
| < 5 years | 2,9 | 1,00 −8,60 | ||||||
| 5 – 14 years | 1,7 | 0,6 – 4,67 | ||||||
| ≫ 15 years | 3,5 | 1,12 −11,17 | 0,02 e | |||||
| Allergic disease | Brenner et al., 2002 | Brenner et al., 2002 | ||||||
| Asthma | 1,34 | 0,73 −2,46 | ||||||
| Hay fever | 2,36 | 1,38 −4,03 | ||||||
| Year of diagnosis | 0,51 | |||||||
| < 10 years – 30 years | 1,60 – 1,93 | 0,51 −5,04 | ||||||
| > 30 years | 4,37 | 1,69 −11,28 | ||||||
| Duration | 0,16 e | |||||||
| < 10 years – 30 years | 2,93 – 5,43 | 1,27 −20,40 | ||||||
| > 30 years | 1,58 | 0,74 −3,38 | ||||||
| Insects | 1,12 | 0,49 −2,54 | ||||||
| Feed | 3,01 | 1,06 −8,53 | ||||||
| Other substances | 3,81 | 1,45 −9,99 | ||||||
| Any allergy | 1,02 | 0,64 −1,63 | ||||||
| Autoimmune disease | ||||||||
| Multiple sclerosis | 3,60 | 0,36 −36,21 | ||||||
| Pernicious anemia | 1,25 | 0,26 −6,06 | ||||||
| Electromagnetic waves | Kleinerman et al., 2005 | |||||||
| (electronic home appliances) Hair dryer | 1,5 | 0,7 – 3,3 | ||||||
| Microwaves | 1,9 | 0,2 – 1,6 | ||||||
| Perm brush (women) | 1,3 | 0,6 – 3,1 | ||||||
| Massage machine | 1,1 | 0,6 – 1,9 | ||||||
| Computer (non-occupational use) | 1,7 | 0,9 – 3,2 | ||||||
| Chemical substances | ||||||||
| (gene polymorphism) | Roos et al., 2003; Roos et al., 2006 | |||||||
| GSTP1 105 Val/Val | 1,3 | 0,6 – 2,9 | ||||||
| GSTP1 114 Ala/Val or Val/Val | 1,2 | 0,6 – 2,5 | ||||||
| CYP2E1 R salt | 2,3 | 1,0 – 5,3 | ||||||
| CYP1B1 V432L CG | 1,2 | 0,7 – 2,3 | ||||||
| EPHX1 Y113H CC | 1,5 | 0,6 – 3,6 | ||||||
| GSTM3 A/B | 1,1 | 0,6 – 1,9 | ||||||
| NQO1 P187S CT e TT | 1,2 – 1,3 | 0,2 – 5,5 | ||||||
| Occupational exposure to magnetic fields (50Hz) | Forssén et al., 2006 | |||||||
| 0.11 – 0.19 μT | 1,02 | 0,85 −1,24 | ||||||
| 0.2 – 0.30 μT | 1,05 | 0,84 −1,31 | ||||||
| ≫ 0.30μT | 1,08 | 0,79 −1,47 | ||||||
| Occupation | Rajaraman et al., 2004 | Rajaraman et al., 2004 | ||||||
| Always worked on this occupation | ||||||||
| Gas station attendants Mechanics and aides | 2,4 | 1,0 – 6,0f | 2,0 | 0,7 – 5,3 | ||||
| Blacksmiths | 2,2 | 0,8 – 5,9 | ||||||
| Buyers | 2,9 | 1,0 −8,8 f | ||||||
| Recreation professionals and physical education teachers | 1,9 | 0,7 – 4,9 | ||||||
| Sales rep | 1,9 | 1,0 −3,5 f | ||||||
| Professors and instructors | 1,8 | 1,0 −3,5 f | ||||||
| Worked for 5 years in the occupation | ||||||||
| Office worker | 1,1 | 0,6 – 2,1 | ||||||
| Professors and instructors Cell phone | 1,7 | 0,7 – 4,0 | ||||||
| Regular use duration 5 – 9 years of age | 1,1 | 0,7 – 2,0 | Lönn et al, 2004 | |||||
| ≫ 10 years of age | 1,6 | 0,7 – 3,6 | ||||||
| Cumulative use | ||||||||
| < 5 years | 1,03 | 0,54 −1,95 | Christensen et al., 2004 | |||||
| ≫ 5 years | 1,1 | 0,4 – 2,8 | Schoemaker et al., 2005 | |||||
| Analogue technology | ||||||||
| Regular use | 1,6 | 0,9 – 2,8 | Lönn et al.,2004; Schoemaker et al., 2005 | |||||
| Time since the first regular use 5 – 9 years | 1,3 | 0,6 – 2,9 | ||||||
| ≫ 10 years Latency | 1,1 – 1,8 | 0,7 – 4,3 | ||||||
| > 1 – 10 years | 5,1 – 9,9 | 1,4 – 69 | Hardell et al., 2005 | |||||
| > 10 years Use side/VS location | 1,5 | 1,02 −2,3 | Hardell et al., 2003 | 2,6 | 0,9 – 8,0 | Hardell et al., 2005 | ||
| Ipsilateral | 4,2 – 5,1 | 1,6 – 14 | Hardell et al., 2003; Hardell et al., 2005 | |||||
| Contralateral | 3,7 – 4,9 | 1,2 – 9,8 | Hardell et al., 2003; Hardell et al., 2005 | |||||
| Ipsi/contralateral | 5,6 | 0,6 – 52 | Hardell et al., 2003 | 3,9 | 0,8 – 19 | Hardell et al., 2005 | ||
| Digital technology Latency | ||||||||
| > 1 – 10 years Use side/VS location | 2,7 | 1,3 – 5,7 | Hardell et al., 2005 | 1,7 | 0,9 – 3,5 | Hardell et al., 2005 | ||
| Ipsilateral | 2,9 | 1,4 – 6,1 | Hardell et al., 2005 | 1,5 | 0,7 – 3,2 | Hardell et al., 2003 | ||
| Contralateral | 1,6 | 0,7 – 3,7 | Hardell et al., 2005 | |||||
| Ipsi/contralateral Wireless telephone | 3,5 | 1,1 – 11 | Hardell et al., 2005 | |||||
| Latency > 1 – 10 years | 1,3 – 1,8 | 0,6 – 3,6 | Hardell et al., 2003 Hardell et al., 2005 | |||||
| Use side/VS location Ipsilateral | 2,4 | 1,1 – 5,1 | Hardell et al., 2005 | 1,3 | 0,7 – 2,7 | Hardell et al., 2003 | ||
| Contralateral | 1,1 – 1,4 | 0,5 – 3,2 | Hardell et al., 2003 Hardell et al., 2005 | |||||
| Ipsi/contralateral | 2,1 – 3,2 | 0,7 – 13 | ||||||
*Presenting minimum and maximum values present in the association value.
a: Odds ratio
b: Relative risk
c: Confidence interval
d: Not described
e: P for trend
f: the author reports that the confidence interval does not include the 1.0.
Negative associations observed in the studies which analyzed risk factors for the vestibular nerve schwannoma
| Risk factor | Negative association measure | |||
|---|---|---|---|---|
| ORa or RRb | CI 95%c | P value | Reference | |
| Family history of cancer | Hill et al., 2004 | |||
| Lung | 0,5 | 0,1 – 1,6 | ||
| Breast | 0,9 | 0,3 – 2,3 | ||
| Any malignant tumor in participants < 50 years | 0,6 | 0,3 – 1,4 | ||
| Sociodemographic metrics Education | Inskip et al., 2003b | |||
| ≪ 3 years of higher education | 0,6 | 0,2 – 1,5 | ||
| Family income Self-reported ($1000) | ||||
| < 15 – 24.9 | 0,1 – 0,7 | 0,0 – 1,9 | ||
| Census data ($1000) < 15 – 24.9 | 1,0 | 0,5 – 2,1 | ||
| Type of health care insurance Governmental | 0,0 – 0,5 | 0,0 – 1,2 | ||
| Marital status Widower | 0,9 | 0,3 – 2,4 | ||
| Divorced | 0,0 – 1,0 | 0,0 – 2,1 | ||
| Separate Religion | 0,0 | 0,0 – 1,2 | ||
| Protestant | 0,8 | 0,4 – 1,4 | ||
| Mormon | 0,9 | 0,2 – 3,4 | ||
| Other Christians Place of birth | 0,4 | 0,1 – 1,4 | ||
| Neighboring states | 0,6 | 0,3 – 1,5 | ||
| Another state in the USA | 0,9 | 0,4 – 1,7 | ||
| Another country | 0,8 | 0,2 – 2,7 | ||
| Laterality | ||||
| Ambidextrous | 0,5 | 0,1 – 1,5 | Inskip et al., 2003a | |
| Left handed and ambidextrous Dental x-ray (after 25 years) | 0,9 | 0,5 – 1,7 | Rodvall et al. 1998 | |
| At least annual | 0,7* | 0,3 – 1,9 | ||
| At least every 5 years Dental filling | 0,4* | 0,2 – 1,0 | ||
| 6 – 15 | 0,9* | 0,4 – 2,1 | ||
| > 15 Noise | 1,0* | 0,4 – 3,1 | ||
| Latency period > 13 years | 0,68 | 0,26 −1,77 | Edwards et al., 2005 | |
| Allergic disease Eczema | 0,92 | 0,34 −2,48 | Brenner et al., 2002 | |
| Medications | 0,53 | 0,20 −1,42 | ||
| Chemical product | 0,79 | 0,22 −2,84 | ||
| Autoimmune disease Rheumatoid arthritis | 0,28 | 0,07 −1,21 | ||
| Lupus | 0 | 0 – 1,38 | ||
| Diabetes | 0,76 | 0,33 −1,77 | ||
| Any autoimmune disease | 0,61 | 0,31 −1,19 | ||
| Electromagnetic waves Home appliances | Kleinerman et al., 2005 | |||
| Shaver (men) | 0,6 | 0,2 – 1,6 | ||
| Electric blanket | 0,8 | 0,5 – 1,3 | ||
| Electric pillow | 1,0 | 0,6 – 1,7 | ||
| Heated water mattress | 0,4 | 0,2 – 0,8 | ||
| Stove | 1,0 | 0,5 – 2,0 | ||
| TV set | ∞ | <0,001 – ∞ | ||
| Sound system | 0,6 – 0,9 | 0,4 – 2,4 | ||
| Air humidifier | 0,8 | 0,4 – 1,5 | ||
| Chemical substances (gene polymorphism) | Roos et al., 2003; Rajamaran et al., 2005; Roos et al., 2006. | |||
| ALAD1 – 2 | 0,9 | 0,4 – 1,9 | ||
| GSTM1 null | 0,9 | 0,6 – 1,6 | ||
| GSTT1 null | 0,9 | 0,4 – 1,8 | ||
| CYP2E1 Ins96 | 0,4 | 0,1 – 1,7 | ||
| CYP1A1 462V AG or GG | 0,5 | 0,1 – 1,4 | ||
| CYP1B1 V432L GG | 1,0 | 0,4 – 2,2 | ||
| EPHX1 Y113H TC | 0,8 | 0,4 – 1,3 | ||
| GSTM3 B/B Occupation | 0,0 | 0,0 – ∞ | Rajaraman et al., 2004 | |
| Has always worked on the occupation | ||||
| Cooks and cook aides | 0,7 | 0,3 – 1,5 | ||
| Administrator/manager | 0,8 | 0,5 – 1,3 | ||
| Nurse, assistant and attendant in hospital | 0,9 | 0,4 – 2,2 | ||
| Office assistant | 0,9 | 0,5 – 1,5 | ||
| Office workers | 0,9 | 0,4 – 1,9 | ||
| Sales people and cashiers | 0,9 | 0,5 – 1,5 | ||
| Waiter and barman Worked for 5 years in the occupation | 0,8 | 0,4 – 1,7 | ||
| Administrator/manager Cell phone | 0,7 | 0,4 – 1,3 | ||
| Regular use | 0,9 – 1,0 | 0,51 – 1,9 | Christensen et al., 2004; Lönn et al., 2004; Schoemaker et al., 2005; Inskip et al., 2001 | |
| Regular use duration | ||||
| 5 – 9 years | 0,86 | 0,39 −1,93 | Christensen et al., 2004 | |
| ≫ 10 years | 0,22 | 0,04 −1,11 | ||
| Cumulative use < 5 years | 0,9 | 0,7 – 1,1 | Schoemaker et al., 2005 | |
| ≫ 5 years | 0,72 – 0,9 | 0,28 −1,89 | Christensen et al., 2004 | |
| Analogue technology Regular use | 0,9 | 0,7 – 1,2 | Schoemaker et al., 2005 | |
| Time since first regular use 5 – 9 years | 0,9 | 0,6 – 1,3 | ||
| Digital technology Latency | ||||
| > 1 year – 10 years | 1,0 | 0,8 – 1,2 | Hardell et al., 2003 | |
| > 10 years Side of use/VS location | 0,8 | 0,1 – 6,7 | Hardell et al., 2005 | |
| Ipsi/contralateral Wireless telephone | 0,9 | 0,3 – 2,7 | Hardell et al., 2003 | |
| Latency > 1 – 10 years | 1,0 | 0,9 – 1,2 | Hardell et al., 2003 | |
| > 10 years | 0,3 – 0,9 | 0,03 – 2,3 | Hardell et al., 2005; Hardell et al., 2005 | |
a: Odds ratio
b: Relative risk
c: Confidence interval
A family history of cancer, investigated by Hill et al.14, does not represent a risk factor for the development of VS, because in the study they only found non-statistically significant (NSS) positive (stomach, colon, prostate, any malignant tumor) or negative associations (lung and breast). The same can be seen in the investigation of laterality as a risk factor, in other words, for left handed individuals there was a positive association (NSS), and for ambidextrous or ambidextrous or left handed, a negative association.
It was noticed that the higher the educational level and family income, the greater the association value (Inskip et al.12). For the remaining sociodemographic metrics (self-reported family income, type of medical insurance, marital status, birth place and religion), positive and negative associations (NSS) were seen.
As to the exposure to dental x-ray, risk estimates were contradictory; in one study they observed a negative association23 and in another, an increase in risk24. Now, in relation to dental fillings, there were only negative associations23.
Exposure to noise revealed a positive association with VS. However, when the analysis considered the occupational or non-occupational exposure, non-statistically significant results were found23,24. The authors also noticed a risk increase for tumor both for continuous noise exposure as well as impact exposure. Noise exposure duration was equal to or higher than 15 years revealed tumors. The authors found associations (NSS) or negative associations for all the genes and variants analyzed. De Roos et al.10 also analyzed these factors according to age and observed a positive association between the CYP2E1 Rsal gene polymorphism in individuals aged below or at 40 years (OR= 8.1; CI 95% 1.7 – 38.9). De Roos et al.17, in the study carried out in 2006, also carried out an analysis according to age including the variables gender and smoking habit and noticed that the NQO1 P187S CT or TT genes polymorphisms present risk for VS in male individuals (OR= 4.8; CI 95% 1.8 – 12.8). They also noticed positive associations (NSS) for three of the five genes analyzed in the study with smokers (CYP1B1 V432L GG, EPHX1 Y113H CC and NQO1 P187S CT or TT).
Rajamaran et al.13 studied the role of occupation in the VS etiology. For that, the participants were distributed in 121 occupational groups. For this systematic review we only listed the occupational groups made up of more than five individuals. For individuals who had always worked as gas station attendants, buyers, sales reps, teachers and instructors had positive associations with VS. Mechanics and aides, blacksmiths, recreation professionals and physical education teachers had positive associations (NSS). There was a negative association for cooks and cook aides, administrator/manager, nurse, hospital attendant and assistant, office aide, office workers, salespeople and cashiers, waiters and barmen.
Among seven studies, four described a negative association regarding the regular use of cell phones8,18,20,26. Time analysis, in years, regarding the regular use of cell phones in these studies revealed positive associations; however, not statistically significant, or negative associations in the different classes considered. Nonetheless, if the use duration is analyzed considering only the strata with less than five years and more than five years, results are contradictory. Studies by Lönn et al.18 and Christensen et al.26 revealed negative associations for periods below five years and in the study by Inskip et al.8 both negative and positive associations (NSS) were seen.
The cumulative use of cell phones was analyzed by Schoemaker et al.22 and Christensen et al.26 and the results for periods lower than or higher than five years were also contradictory, sometimes revealing a negative association, and sometimes a positive one (NSS). In 2003, Hardell et al.25 observed that a latency period of more than 10 years regarding the use of analogue cell phones represents a risk factor for VS. In the publication of 200527, results indicated a strong association for latency periods of less than 10 years. Nonetheless, considering the period of 5 to 9 years, the study carried out by Lönn et al.18 revealed a positive association (NSS), and the study carried out by Schoemaker et al.22 revealed a negative association. For digital cell phones, there was a positive association for a latency period from five to ten years.27.
The analysis of the association between the side of cell phone use and VS revealed an increased risk regardless of the side of analogue cell phone use25,27and the ipsi/contralateral use of the digital cell phone27. Nonetheless, in studies carried out by Inskip et al.8 and Muscat et al.20, although the cell phone technology was not considered in the analysis, there was no relationship seen between the side of cell phone use and tumor side.
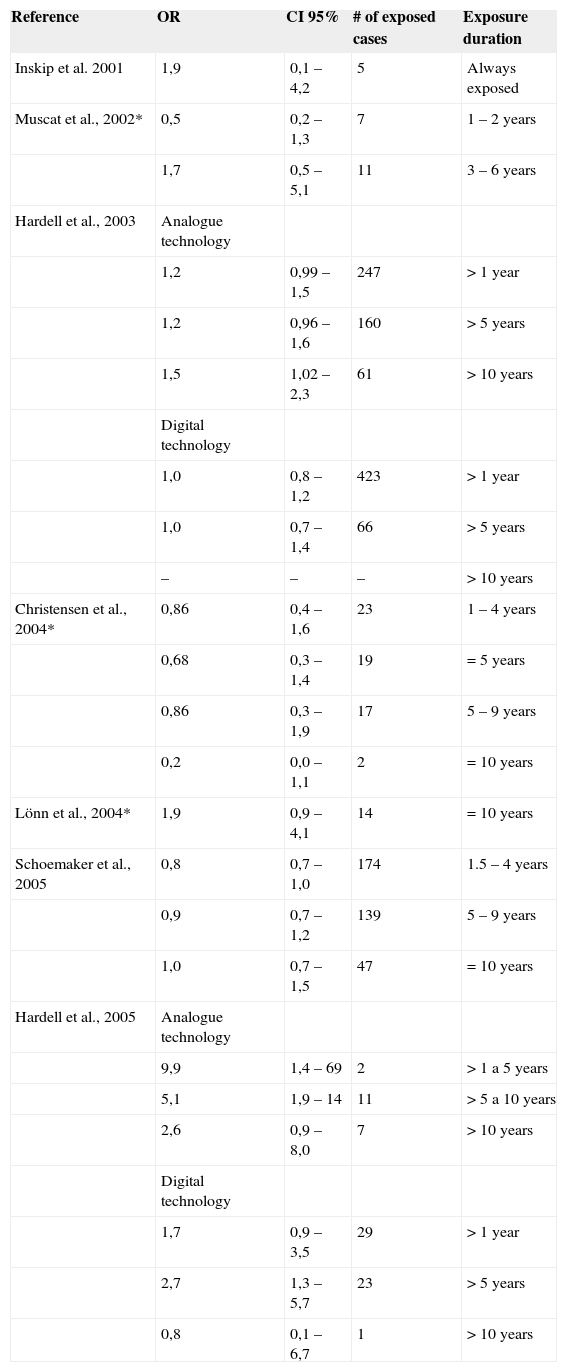
Table 5 presents the cases, according to exposure duration, and the association measures of VS and cell phone. No study assessed a long exposure time or a long latency period, and they all have reduced numbers of cases in the strata that represent the greater period of exposure. The remaining variables (average of daily use in minutes, year in which the person started using the cell phone, first technology system of the cell phone used, cumulative use, and in years - the number of calls) revealed positive (NSS) or negative associations.
Results and number of cases exposed in the investigations carried out in relation to the risk factor - cell phone - for vestibular nerve schwannoma
| Reference | OR | CI 95% | # of exposed cases | Exposure duration |
|---|---|---|---|---|
| Inskip et al. 2001 | 1,9 | 0,1 – 4,2 | 5 | Always exposed |
| Muscat et al., 2002* | 0,5 | 0,2 – 1,3 | 7 | 1 – 2 years |
| 1,7 | 0,5 – 5,1 | 11 | 3 – 6 years | |
| Hardell et al., 2003 | Analogue technology | |||
| 1,2 | 0,99 – 1,5 | 247 | > 1 year | |
| 1,2 | 0,96 – 1,6 | 160 | > 5 years | |
| 1,5 | 1,02 – 2,3 | 61 | > 10 years | |
| Digital technology | ||||
| 1,0 | 0,8 – 1,2 | 423 | > 1 year | |
| 1,0 | 0,7 – 1,4 | 66 | > 5 years | |
| – | – | – | > 10 years | |
| Christensen et al., 2004* | 0,86 | 0,4 – 1,6 | 23 | 1 – 4 years |
| 0,68 | 0,3 – 1,4 | 19 | = 5 years | |
| 0,86 | 0,3 – 1,9 | 17 | 5 – 9 years | |
| 0,2 | 0,0 – 1,1 | 2 | = 10 years | |
| Lönn et al., 2004* | 1,9 | 0,9 – 4,1 | 14 | = 10 years |
| Schoemaker et al., 2005 | 0,8 | 0,7 – 1,0 | 174 | 1.5 – 4 years |
| 0,9 | 0,7 – 1,2 | 139 | 5 – 9 years | |
| 1,0 | 0,7 – 1,5 | 47 | = 10 years | |
| Hardell et al., 2005 | Analogue technology | |||
| 9,9 | 1,4 – 69 | 2 | > 1 a 5 years | |
| 5,1 | 1,9 – 14 | 11 | > 5 a 10 years | |
| 2,6 | 0,9 – 8,0 | 7 | > 10 years | |
| Digital technology | ||||
| 1,7 | 0,9 – 3,5 | 29 | > 1 year | |
| 2,7 | 1,3 – 5,7 | 23 | > 5 years | |
| 0,8 | 0,1 – 6,7 | 1 | > 10 years |
* Time, in years, since the first regular use
+ Latency
+ Time, in years, since the first use
Two studies analyzed wireless telephones25,27. For latency periods > 1 year up to 10 years, there was a positive association (NSS) or negative association according to the new classification established for this systematic review. Nonetheless, when we checked the original classification of the studies for this variable, we noticed an increase in the risk for latency periods greater than five years and less than 10 years in the study of 2003 (OR= 1,3; CI 95% 1.01-1.7). In the study from 200543 this finding was not confirmed (OR= 1.4; CI 95% 0.6-3.2). For latency periods above 10 years, both studies indicated a negative association. In relation to the side of wireless telephone use and tumor location, there was a positive ipsilateral association with the VS only in the 2005 study27.
DISCUSSIONVS etiology is still obscure and rare are the investigations carried out in relation to tumor risk factors. Of the 265 studies found and used for this systematic review, only 7.5% represented investigations regarding environmental, occupational or genetic risk factors for VS.
We notice that the investigation of risk factors for VS is a recent task and may be associated with the progress in diagnostic resources and consequent raise in incidence rates which provide investigation tools and called out attention to the knowledge gap regarding the etiology of this tumor. The present investigation was restricted to a systematic review; it was not possible to do a metanalysis because the variables studied in the investigations we selected were classified in different ways or in non-comparable strata.
Association between risk factors and vestibular nerve schwannomaAmong the 20 studies analyzed we noticed the role of 15 different exposures in the development of VS. Of these, only seven can be considered as tumor risk factors, in other words, revealed at least once a statistically significant positive association (educational level, family income, occupation, hay fever and exposure to ionizing and non-ionizing radiation and high levels of sound pressure).
Inskip et al.12 observed that the educational level (equal to or higher than four years of higher education) and family income (equal to or higher than 25,000 dollars) represent risk factors for VS. These results are questionable and must be interpreted carefully, because individuals with higher education and better economic situation usually have more access to health information. Consequently, we can imagine a better skill to recognize signs and symptoms of diseases and a greater clarification regarding treatment and its benefits, which reflect the search for medical care. Thus, educational level can become a confounding variable and it is not a surprise that in five studies selected the results obtained have been adjusted by this variable.
The proximity between the dental arch and the skull has led some to speculate that the exposure to dental x-ray can be associated with the development of brain tumors. Preston-Martin et al.24 investigated this exposure and observed a positive association for an annual x-ray, before or after 25 years of age. This finding corroborates the increase in brain tumor risk, among them the VS, observed in the studies with survivors of the A-Bomb in Japan28 and with individuals who during childhood received ionizing radiation for the treatment of scalp disorders, tonsils and other areas of the skull and neck29.
Nonetheless, results from Preston-Martin et al.24were not confirmed by Rodvall et al.23, in which a negative association was observed for individuals who underwent dental x-ray up to once a year. However, results from Rodvall et al.23 must be interpreted carefully, because besides a small case sample (36), the authors reported that the quality of exposure data was compromised because of the bad quality of the individuals' dental records.
Epidemiological studies on ionizing radiation report this exposure as an etiological factor for tumors in adults. According to Harley30, the exposure to ionizing radiation frequently damages the DNA structure and this data is directly associated with the exposure dose and to the chemical structure affected. Experimental studies with mammal cells revealed that the DNA damage can occur because of the rupture of one or the entire double helix of the DNA and also by the breaking of the chemical bond between the molecules that make it.
Brenner et al.9 observed a positive association between hay fever, allergy and other substances (plants, dust or animals) and food allergy and VS. The authors argue that the association with hay fever can reflect a further diagnostic investigation and consequent accidental finding of a tumor because of Eustachian tube dysfunction and otitis media symptoms associated with allergic rhinitis. Nonetheless, the authors do not rule out the possibility of hay fever or even allergy - because of the overstimulation of the immune system - promoting tumor development. The association observed between allergy and other substances or food allergy and VS can be questioned, since only individual self-reports were considered in the classification of those exposed and not-exposed. There are no reports in the literature of other studies on the role of allergic disease history for VS development. However, prior studies31,32 described a risk reduction for glioma, but not for meningioma in individuals with prior history of allergic disease.
Studies by Preston-Martin et al.24 point to the association between VS and occupational exposure to noise in men. Thus, results from Edwards et al.19, assessing individuals from both genders indicated an increased risk for the tumor. These results corroborate the hypothesis that acoustic trauma, stemming from the exposure to high levels of sound pressure contribute to tumor appearance. Experimental studies with rodents have shown that impact noise causes mechanical damage to the organ of Corti and neighboring tissues, including the VIII nerve33,34and the Schwan cells (JT Corwin, personal communication apud Edwards et al.19). Corwin & Cotanche35 and Ryals & Rubel36, in studies with chicken and quails, confirmed that the ear sensorial cells are destroyed and subsequently regenerated after acoustic trauma. Thus, it is plausible that the VS stems from mechanical trauma caused by exposure to high levels of sound pressure and the consequent process of cell repair - in which cell division determines DNA error replication and allows for a disorganized cell proliferation.
Preston-Martin et al.24 and Edwards et al.19 also analyzed the type of noise and noticed a risk increase both for impact noise as well as for continuous noise, and the association value was higher for the former. The authors also noticed that for periods equal to or higher than 13 years, there was a risk increase proportional to the increase in latency period. These findings can be explained, by analogy to the damage caused by noise to the hearing system, by the phenomenon described by Hammernik et al.33 in experimental studies involving rodents. The authors found that impact noise can instantaneously destroy 60% of the cochlea, while continuous noise would only cause such effect after long years of exposure and also by the observation that impact noise caused more damage to the nerve and adjacent tissues.
More than a billion people use cell phones all over the world and these numbers are growing rapidly37. In Brazil, according to the National Telecommunications Agency (ANATEL)38, in May of the present year mobile telephony reached the figure of 105,090,535 subscribers. Thus, there is a public health concern regarding the effects of the exposure to radiofrequency waves on a person's health. Studies on the association between cell phones and VS are controversial. Many of the studies done have methodological limitations and the results must be interpreted carefully. We noticed that the authors analyzed different characteristics of this exposure and also classified in a different way all the variables studied. This fact also made it difficult to analyze this risk factor and can be seen in the analysis of the cumulative-use-in-hours variable. All the studies that analyzed this variable8,18,20,22,25,27 established different strata and thus, the results were controversial, that is, analyzing periods of hours of a study that would all fit a given stratum of another study, some times the variable studied revealed a negative association regarding VS, sometimes it revealed positive associations, without statistical meaning.
The analysis of these studies point to the association between the use of analogue cell phone and VS25,27. However, the findings are contradictory, since Harrell et al.25 observed a risk increase for VS in analogue cell phone users for a latency period longer than 10 years. In the study carried out in 2005 results indicated a strong association regarding latency periods shorter than 10 years27. Nonetheless, for digital cell phones we noticed a positive association only during the latency period from five to ten years27. Although the association measure in both studies indicated a strong association between cell phone use and VS, results must be interpreted carefully, because confidence intervals are broad due to small sample sizes.
Radiofrequency waves emitted during the use of cell phones are absorbed by the skin and bones around the ear and may raise tissue temperature39,40. Such phenomenon led to speculations that a thermal mechanism could trigger or accelerate the growth of subclinical brain tumors41,42. However, according to Rothman et al.43 we must consider that this temperature raise is small, around 0.1° to 0.2°C, and that radiofrequency waves are rapidly damped as they pass through the tissue, so much so that less than 10% of the power emitted penetrates up to 4-6 centimeters in the skull.
A recent study on the effects of exposure to radiofrequency electromagnetic fields44 revealed chromosomal aberrations in fibroblasts and an increase in intracellular free radicals. These findings allow us to conclude that radiofrequency waves can activate genes which play an important role in cell division, proliferation and differentiation support the hypothesis of genetic mutations in the development of chronic diseases, such as cancer, because of cell phone use.
The analysis of the association between cell phone use and VS showed a risk increase, regardless of the side the cell phone was used - that for analogue devices41,25,27and ipsi or ipsi/contralateral side for digital cell phones27. Because of cell phone use near the temporal region, it is likely that this exposure characteristic could be associated with the tumor development. Nonetheless, the findings from the studies do not point only to a VS risk increase with cell phone use ipsilateral to the tumor side. Thus, it is not very likely that the absorption rate explains contralateral tumor occurrence. The findings from these studies may have been influenced by the presence of unilateral tinnitus and hearing loss - characteristic of this disease, because it can alter use pattern and consequently interfere in the questionnaire responses.
It has been observed that all the studies which consider the variables: technology, latency and cell phone use side simultaneously, show results which indicate a positive association with VS18,22,25,27.
The studies which investigated landline and wireless cell phone exposure and Vs risk found a positive association according to latency period and phone use side (ipsilateral). However, these associations reveal contradictions, because while they behave like risk factors in one of the studies27, in another they revealed negative associations25. According to Hardell et al.27 the use of landlines and wireless telephones has not been discussed as a risk factor for brain tumors in the study carried out regarding exposure to non-ionizing radiation. However, the author's findings - statistically significant positive association with ipsilateral phone use and tumor side, can not be explained by a memory bias.
The findings from the study carried out by Rajamarm et al.16, in which occupation was investigated, must be interpreted carefully because of the small number of individuals in each occupational group. Moreover, one must consider that for the occupations which revealed positive association for VS (gas station attendants, buyers, sales reps, teachers and instructors) the authors do not discuss probable characteristic exposure which may be associated with tumor development. Nonetheless, we see that in all these occupations the individuals have a greater contact with the public and thus, we can suppose that these individuals may obtain further information on the signs and symptoms of diseases and, consequently, reflect on the search for diagnosis and incidental tumor finding.
Methodological limitations of the epidemiological studies which investigated risk factors associated with vestibular nerve schwannomas
Among the studies analyzed, the limitations observed for conclusive results were: reduced sample size14,16,23, greater participation rate among the cases18,19,22, use of hospital controls8-10,12,13,15,17,22 and the interviewers were not blind to the fact that the individuals were cases or controls9,19,24.
Since the VS is a relatively rare disease1,3,4 and the design of the study chosen, in all the papers analyzed, was the case-controlled - despite the recommendation of choice for this type of study for low incidence diseases45, frequent are the criticisms regarding this design because of bias susceptibility45,46.
One of the aspects to be considered on the analysis of findings regularity is sample size46,47. It is not always that establishing sample size is an easy task, and much less the finding of a desirable number of individuals to provide a good statistical power to the study. In three of the 20 studies selected, it was seen that the reduced sample size and what drew our attention was that in none of the studies analyzed there was a statement about sample size calculation. Thus, the findings of these investigations are questionable and do not explain the role of the risk factors studied regarding VS development.
A greater participation of individuals from the case group when compared to the control group, as observed in three other studies, can cause a study selection bias, because the population representativeness assumption to which the study is proposed does not happen46,47.
Memory limitations, always present in any study seeking information about past events are directly related to the respondents' cognitive skills. In many situations there is the need to count on the participation of substitute respondents, which challenges the quality of the information. There are no reports in the literature pointing to a cognitive impairment in individuals with VS,48 thus, the participation of substitute respondents can be minimized, was observed in four of the selected studies8,9,12,14.
Time interval between exposure and disease diagnosis and when the interview was carried out can also impact the individual's recollection capacity. VS has variable growth rate, signs and symptoms and, thus, diagnosis can be delayed and consequently establish a longer time span between the exposure and the disease. Of all the studies analyzed, three reported that the interview with the cases was held immediately after diagnosis14,15,27.
Information regarding past exposures can also be weakened because of the emotional and social meaning of the events investigated and by the level of details required in relation to these events. This assumption was not observed in the investigations which tested the association between cell phones and VS, since details regarding technology, side of use and latency period contributed to establish this factor as a risk for developing the disease.
The differences in response obtained between the case and control groups can cause a memory bias. This can happen because the cases usually are more motivated to report possible exposures than their healthy control counterparts and also because the cases have more opportunities to think about possible causes for the disease because of the medical visits and exams they have been through. In relation to hospital-based case-control studies one could imagine that this rumination bias was minimized because the controls were admitted to the same hospitals as the cases with a variety of non-malignant conditions. Nonetheless, this apparent advantage can also be a limitation46,47,49,50, since controls have varied diagnoses and use different drugs which can also somehow be associated with the disease under investigation. For instance, Brenner et al.9, in their study about the past of allergy and autoimmune disease and VS, did not investigate the use of medication and, thus, the authors did not rule out their interference in the results attained. The care in excluding controls with diseases that could be associated with the study hypothesis was taken in one of the investigations selected16.
Case-control studies are recommended in incidental cases in order to mitigate a possible survival bias. Most of the studies analyzed (18) included only incidental cases and in two of them there were no reports whether the cases were incidental or prevalent. VS is a benign tumor with a low lethality rate1,2,4 thus, there is no risk of losing sample individuals during the study, making it possible to include prevalent cases as well.
Interviewers' knowledge judgment and values may also interfere on the responses of the individuals and distort the results. This concern was visible in most of the studies analyzed since the interviewers were trained and blinded in relation to the situation of the interviewee - as for being a case or a control. Such measures aim at minimizing the effect of a possible checking bias. In the studies led by Brenner et al.9, Preston-Martin et al.24and Edwards et al.19 it was not possible to blind the interviewers regarding interviewee status. However, in the first they were not informed about study hypothesis and in the other ones the interviewers were properly trained.
Problems measuring exposure to the investigated risk factorsChecking past facts in order to estimate exposure to a given risk factor is not only impacted by memory45but it is also directly associated to the instrument used and the collection technique. Most of the studies selected for this systematic review (14) used only questionnaires (instruments) in order to check exposure and it was only in five of them that the information collected was validated using other data sources. In 17 studies there were personal interviews, which allows for a certain interaction between researcher and interviewer, and it also helps explain possible doubts which could crop up because of the very difficulty of understanding by the interviewee. Another advantage of this technique is the employment of questionnaires by the researcher in such as way as to guarantee that they will all be entirely filled out, minimizing the exclusion of individuals due to incomplete data.
Of the two studies which investigated the risk factor of dental x-rays for VS, both used questionnaires in order to obtain information regarding the number of radiographs performed and, in one of them, these data were validated by the individuals' dental records. Nonetheless, none of the studies reported data regarding the dose of radiation to which the individual was exposed.
The validation of the information provided by the individual was carried out in only one of the studies which investigated the risk of exposure to high levels of sound pressure to VS development - in this study they considered only those exposed individuals who reported occupations listed by the national research on occupation risk carried out in the USA (NOHS) as those which involved exposures to high levels of sound pressure. In the study in which a family history of cancer was investigated, the authors confirmed the cancer cases reported by the individuals.
Regarding measuring exposure to high levels of sound pressure we must also consider the fact that workers exposed to noise can develop hearing loss and, therefore, normally undergo periodic tests more often than the population in general. This fact can facilitate diagnosis and increase tumor incidence rate in this specific population. Moreover, there are possibilities for these individuals to establish a relationship between the exposure and the disease and thus determine greater response accuracy. In estimating noise exposure, the investigation of potential effect confounding or modifying factors must also be considered, because in many occupations there is concurrent exposure to chemical products. This fact was seen in only one of the studies analyzed which investigated noise exposure as a risk factor.
The results attained in the studies which investigated the role of allergic disease and autoimmune history must be interpreted carefully, because the authors did not check the exposure to drugs used by the individuals which may act as confounding of modifying factor to the association effects. We must stress that for only one of the investigated allergic disorders the medical diagnosis was considered in order to classify exposed individuals.
Investigations about cell phone and wireless phones also used only questionnaires in order to check exposure. Result divergences and evidence contradictions in these studies may be associated to the recent introduction of cell phones in the market, in other words, the temporal relationship between exposure measurement and disease can not contemplate the latency period necessary for tumor development. Moreover, it is likely that the small number of individuals in the strata with greater time of exposure may also have contributed to result scatter and lack of uniformity. Such particularity was also noticed in the study which investigated the association between occupation and VS, because the authors created 121 occupational groups in order to classify exposure and in many of them there was a reduced number of participants.
Another aspect to be analyzed is the cell phone technology used by the individual. In the first years, after mobile phones were introduced in the market, only analogue technology devices were available, and today there are also digital cell phones available. The frequency ranges used by analogue and digital cell phones are different; therefore it is desirable to have accurate information regarding the use of one or the other technology. Nonetheless, the investigation of such exposure may not be accurate because of our lack of knowledge regarding the technology used by the individual and also by the difficulty in remembering for how long each one of the technologies was used. We also have to consider the use of both, as well as the time during which cell phone use was discontinued. Thus, it is likely that a greater accuracy regarding cell phone exposure can only be reached through the validation of information provided by the individuals with data from cell phone carriers. Considering the fact that VS is usually unilateral, when considering cell phone exposure one has to consider the side on which the cell phone is used. Nonetheless, this exposure is not always accurately measured, since hearing loss or tinnitus may change cell phone use patterns.
The exposure to electromagnetic waves from household appliances was also investigated in the questionnaire which included the frequency and duration of use of the different devices. Notwithstanding, in establishing such time, use discontinuation was not considered, since such fact was not investigated.
Digital-manual laterality investigation as a risk factor for VS was carried out by means of two simple questions presented personally to the participants at the time of hospital admission. In such exposure testing, one must consider the impact of sociocultural factors used to establish or to modify the digital-manual laterality.
Regarding exposure checking to different sociodemographic indicators, besides the answers given by the individuals, census data regarding family income were also considered in the classification of those exposed and not exposed. For the remaining factors investigated, only the interviewees' reports were considered for exposure classification.
CONCLUSIONSEducation (equal to or higher than four years of higher education) and family income (equal to or higher than 25,000 dollars), occupation, hay fever and exposure to ionizing and non-ionizing radiation and high levels of sound pressure are risk factors for VS, according to the association values presented in the studies we analyzed here. Nonetheless, the analysis of the methodological quality and findings accuracy through confidence interval and biologic likelihood between exposure and outcome, suggests the exposure to ionizing (dental x-ray) and non-ionizing (cell phone) radiation and high levels of sound pressure as more important risk factors. Although the studies which reveal these factors as risks for VS development were better carried out from the methodological standpoint and their findings were more accurate, one must assess tumor development latency period, the reduced number of exposed individuals and the problems encountered with exposure checking are still not clear about the role of these factors in the disease etiology. Thus, future investigations are necessary in order to have a better understanding of such issue, which findings can help establish preventive measures, as well as contribute to an earlier diagnosis, before signs and symptoms ensue and, consequently, impact on the reduction of sequelae stemming from surgical intervention.
Paper submitted to the BJORL-SGP (Publishing Management System – Brazilian Journal of Otorhinolaryngology) on November 19, 2007; and accepted on February 21, 2008. cod. 5275
gology is pleased to honor the reviewers


- Home
- All contents
- Publish your article
- About the journal
- Metrics