
Aim: To detect early on a probable hearing loss in children of women exposed to occupational noise during their pregnancy and to verify if there is any difference between the children from those women exposed to occupational noise during their pregnancy and the ones from mothers that do not work under the same conditions. Methods: Children from women exposed to occupational noise during their pregnancy and children from women who were not exposed were evaluated through distortion product otoacoustic emissions, using the GSI 60 DPOEA SYSTEM equipment and the frequency-ratio F2/F1 equal to 1.2 and the geometric average of 2F1-F2. The intensity of the primary frequencies were kept steady with values of L1=65dBSPL and L2=55dBSPL for F1 and F2, respectively. Student T test in paired samples and independent samples were used. Results: There were no differences in the response amplitude of distortion product otoacoustic emissions between the control and the study groups. There was no statistically difference between male and female children in response amplitude for the two groups aforementioned; and there were no differences between right and left ears from each group. Conclusion: We did not observe hearing impairment in children whose mothers were exposed to occupational noise during pregnancy when compared to the children from mothers who were not. There was no difference between the right and left ears, nor between male and female children in each group.
Although temporary, sound pollution is responsible for great harm. Such pollution, dealt upon as noise, can be social or occupational. Social noise is the one caused by discos, noisy cars, rock bands, usually of short duration and that, if isolated and episodic, would hardly cause hearing problems to men1.
In general, those who work exposed to noise levels above 85dBSPL and under long standing exposure must be monitored. Auditory monitoring can be carried out by means of threshold tonal audiometry, which determines the least sound intensity capable of causing auditory sensation in each frequency tested, using a pure sound stimulus, and this is the one most employed in factories.
Another method is evoked otoacoustic emmission2-9 which is obtained in response to previous sound stimulation, and it can be with pure tones - by distortion products of pre-established frequencies, which analyzes cochlear activities in specific frequencies10-13 or by a very short sound stimulus, a “click” - transitory and that represent a global cochlear response11. It is an objective, quick, non-invasive and easily applicable method 14-17, including the screening of children in high risk nurseries18.
Until very recently, the concern in assessing the hearing of those exposed to noise was limited to males. However, with the need to contribute financially to the household, women today represent almost 50% of the work force and are present in a sizeable share of the world industrial setting and, most of them are in their reproductive years19. It is known that there is a greater individual susceptibility; however, there is no clinical evidence that men or women be more prone to hearing problems when exposed to noise.
It is known that when a sound wave goes from the air medium (outer and middle ear) to the liquid medium (labyrinthine liquids), 99.9% of this energy is lost. It is also known that the human fetus is protected inside the mother’s womb and the tissues and liquid around this harmless being may damp environmental noise20,21 and, according to a quote from Niemtzow22 (1982), such damping shall be more effective as the frequency increases. Thus, lower frequencies are less damped, and therefore are the most harmful to the fetal cochlea.
Many are the papers that discuss the effects of occupational noise on the fetus21-26; however, few approach its effects on the fetus’s hearing27. It is debated whether or not noise may cause low birth weight28,29 or bring about alterations to the immune system30. The possible devastating effect occupational noise may have on this future human has been considered, and thus we deemed relevant to invest in this research project, trying to establish a cause/effect relation in regards of these women and their work environment.
In the present investigation, the target public is, therefore, the children born from women who, during pregnancy were exposed to occupational noise. Since tonal audiometry is a method that is impossible to be used in neonates because it requires a behavioral answer from the examinee, otoacoustic emissions bear the ideal traits to be the exam of choice in these cases3,12.
The goals of the present investigation were:
- 1.
Provide for an early detection of hearing loss in children born from women exposed to occupational noise during pregnancy;
- 2.
Check to see whether there is any difference in the results of otoacoustic emissions - distortion product - amplitudes among the children born from mothers who were exposed to occupational noise and the children born from mothers who were not exposed to occupational noise.
This work was developed at the department of Speech and Hearing Therapy of the Núcleo de Atenção Médica Integrada (NAMI), of the University of Fortaleza (UNIFOR), from August 2002 through June of 2003. Patients underwent otorhinolaryngology exam, followed by otoacoustic emissions - distortion product (DPOAM), after informing the guardian and obtaining a signed consent. The study was approved by the Ethics Committee of both universities: University of Fortaleza and the Federal University of São Paulo (UNIFESP-EPM), protocol # 0330/03.
The object of our study were children with ages ranging from 0 to 6 months, of both genders and without any risk factor for hearing loss, according to the recommendations established by the preliminary screening group of neonatal screening, formed by the Brazilian Society of Otorhinolaryngology in May of 2000. Those children who presented some risk indicator for hearing loss were taken off the study.
The women (mothers) come from the same socio-economical background (family income equivalent to 1-2 minimum wages). We also excluded those women who worked exposed to chemical products and who smoked during pregnancy26.
Questionnaires were answered during interview with the researcher on the pregnancy and delivery conditions, considering birth weight and height, mother’s and relatives’ past, and that of the child being investigated, and also the mother’s professional activity during pregnancy. Thus, all the aforementioned variables were eliminated and the children were selected.
All the children were submitted to an otorhinolaryngological evaluation, in an attempt to investigate cranio-facial malformations and rule out external and/or middle ear involvement, by means of an otoscopy. Those children with external and/or middle ear problems were treated clinically and then reassessed. When there were within normal parameters, they were approved to join the study.
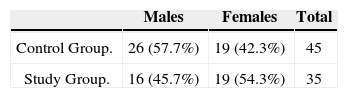
The study was carried out with 80 children who were distributed in two groups: study and control. The first was made up of 35 children with ages varying between 0 and 6 months, of both genders, born from women exposed to occupational noise above 80dBSPL (intensity range above 80dBSPL and below 90dBSPL), in an 8 hour daily work routine, making up a total of 40 hours per week of work during pregnancy, and whom both the gestation and delivery happened without complications. The children hereby studied are from women who worked in a nuts processing plant, located in the city of Cascavel, in the state of Ceará, 60 Km away from Fortaleza. All these women worn personal protection equipment (PPE) - ear plug - during their work routine and kept working exposed to occupational noise until at least the 8th month of pregnancy, and most took maternity leave 15 days before delivery (Table 1).
The control group was formed by 45 children, also from both genders, with matching ages to those in the study, born from women who were not exposed to occupational noise during gestation, from the Dendê community and who are followed at the NAMI, without the same hearing loss risk factors of those children in the study, who went through the same assessment procedure (Table 1).
MethodAll women in both groups received prenatal care and conceived children in public maternities under the care of a health care professional. Data on birth conditions and the child’s status at delivery were collected from the child’s vaccination card or from the birth records provided by the maternity.
Otoscopic ExamThe equipment used for the otorhinolaryngological assessment were a Kole headlamp and a Heine otoscope. This assessment was necessary in order to check external and middle ear integrity, which function is essential in order to properly capture the otoacoustic emissions.
Distortion Product - Evoked Otoacoustic EmissionsThe children who passed the otorhinolaryngological exam were submitted to auditory analysis by means of the distortion product - evoked otoacoustic emissions.
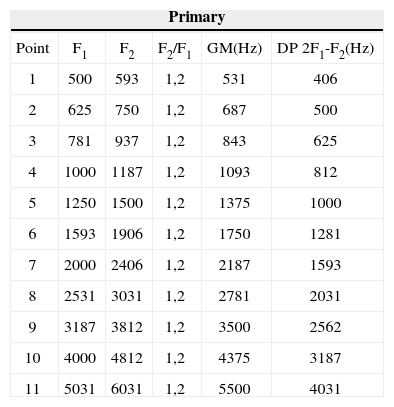
In order to record the DPOAE we used a GSI 60 DPOEA SYSTEM. Recording took place after the generation of two pure tones F1 and F2, where F2 was always higher than F1 and were called primary frequencies. F2 varied between 593 Hz and 6031 Hz and its geometric average (GA) followed the 2F1-F2 standard in the F2/F1 ratio equal to 1.2. The primaries F1 and F2 (L1 for F1 and L2 for F2) stimuli intensities remained fixed at 65dBSPL and 55dBSPL, respectively, in other words, L1 was greater than L2 in 10dBSPL. The DPOAE measures were carried out from the low to the high frequencies.
An acoustic probe with two receivers (micro-speakers) was coupled to the measuring device, which were responsible for the emission of acoustic signals (F1 and F2) and 1 high sensitivity miniature microphone used to collect the DPOAE, and this whole set of transducers were assembled in a small probe similar to the one used in immitanciometry, and which was coupled to the external auditory meatus by means of a rubber plug of proper size for each child tested.
The device was calibrated whenever turned on, using a 2cm3 cavity simulator, where we checked the correct sealing and working of the transducers and necessary adjustments for calibration purposes were made by the device itself.
The distortion products and background noises were recorded and analyzed in relation to the sound frequencies, as shown on Table 2.
F1 and F2 primary frequencies and distortion product for 2 F1-F2
| Primary | |||||
|---|---|---|---|---|---|
| Point | F1 | F2 | F2/F1 | GM(Hz) | DP 2F1-F2(Hz) |
| 1 | 500 | 593 | 1,2 | 531 | 406 |
| 2 | 625 | 750 | 1,2 | 687 | 500 |
| 3 | 781 | 937 | 1,2 | 843 | 625 |
| 4 | 1000 | 1187 | 1,2 | 1093 | 812 |
| 5 | 1250 | 1500 | 1,2 | 1375 | 1000 |
| 6 | 1593 | 1906 | 1,2 | 1750 | 1281 |
| 7 | 2000 | 2406 | 1,2 | 2187 | 1593 |
| 8 | 2531 | 3031 | 1,2 | 2781 | 2031 |
| 9 | 3187 | 3812 | 1,2 | 3500 | 2562 |
| 10 | 4000 | 4812 | 1,2 | 4375 | 3187 |
| 11 | 5031 | 6031 | 1,2 | 5500 | 4031 |
DPOAE were considered present whenever the distortion product amplitude value were positive, with a difference equal to, or higher than 6dBSPL in relation to the background noise, in other words, a signal to noise ration difference equal to or higher than 6dBSPL. Negative amplitudes, with differences below 6dBSPL were considered absent. We always tried to keep noise levels below zero (negative). Cases of excessive noise, masking the response, were not analyzed.
The exam was carried out in an acoustically treated room and booth, in the selected children that, after fed, were sleepy or slightly asleep and in the arms of the mother or guardian.
Statistical analysisThe statistics used for data analysis was based on the t-Student test for averages comparison in: (i) paired samples (dependent) and (ii) independent samples.
The significance level used in the tests conclusion was of 0.05 in all the tables and we present edthe descriptive level of the tests (p-value), in other words, minimum significance level to be used for ruling out the hypothesis H0. Data were analyzed by means of the SPSS version 8.0 statistics software.
RESULTSStudy of the distortion product amplitudes and background noise in function of the ear side variable in both the control and the study groups
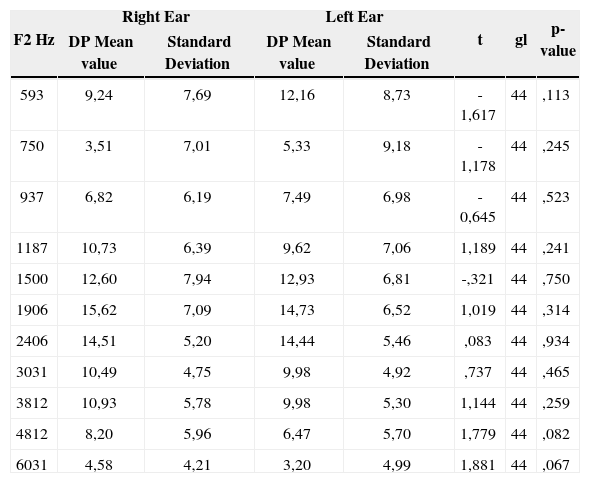
Hereby we present the results from the distortion product - evoked otoacoustic emissions and back ground noise in children born from mothers who were not exposed to occupational noise during pregnancy (control group), analyzing their response amplitudes for each ear and, following that, comparing them among each other. We used the t-Student test for paired samples (significant for p < 0.05) and there was no statistically significant difference between right and left ears for the distortion product and background noise amplitude averages in the control group. As for the study group, the right ear presented a statistically significant difference in the frequency of 1500 Hz when compared to the left ear, in other words, the right ear presented better distortion product amplitude average when compared to the left ear. As for background noise, there was no statistically significant difference between right and left ears in the study group.
mean values, standard deviation and student t test (paired samples) in order to compare DP (distortion product) mean values obtained for right and left ears – control group
| F2 Hz | Right Ear | Left Ear | t | gl | p-value | ||
|---|---|---|---|---|---|---|---|
| DP Mean value | Standard Deviation | DP Mean value | Standard Deviation | ||||
| 593 | 9,24 | 7,69 | 12,16 | 8,73 | -1,617 | 44 | ,113 |
| 750 | 3,51 | 7,01 | 5,33 | 9,18 | -1,178 | 44 | ,245 |
| 937 | 6,82 | 6,19 | 7,49 | 6,98 | -0,645 | 44 | ,523 |
| 1187 | 10,73 | 6,39 | 9,62 | 7,06 | 1,189 | 44 | ,241 |
| 1500 | 12,60 | 7,94 | 12,93 | 6,81 | -,321 | 44 | ,750 |
| 1906 | 15,62 | 7,09 | 14,73 | 6,52 | 1,019 | 44 | ,314 |
| 2406 | 14,51 | 5,20 | 14,44 | 5,46 | ,083 | 44 | ,934 |
| 3031 | 10,49 | 4,75 | 9,98 | 4,92 | ,737 | 44 | ,465 |
| 3812 | 10,93 | 5,78 | 9,98 | 5,30 | 1,144 | 44 | ,259 |
| 4812 | 8,20 | 5,96 | 6,47 | 5,70 | 1,779 | 44 | ,082 |
| 6031 | 4,58 | 4,21 | 3,20 | 4,99 | 1,881 | 44 | ,067 |
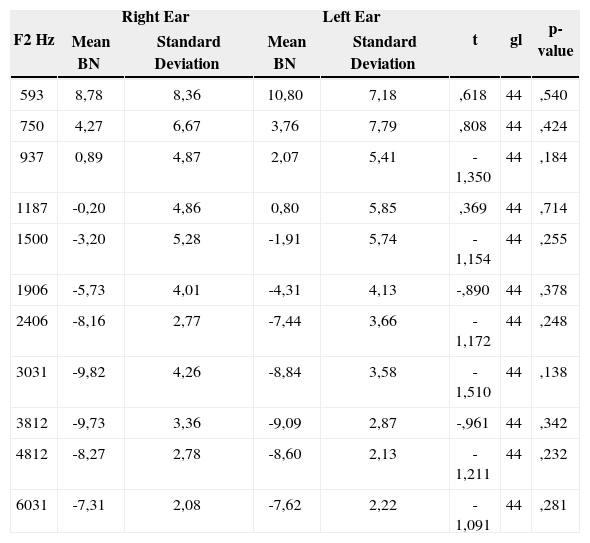
mean values, standard deviation and student t test (paired samples) in order to compare BN (background noise) mean values obtained for right and left ears – control group
| F2 Hz | Right Ear | Left Ear | t | gl | p-value | ||
|---|---|---|---|---|---|---|---|
| Mean BN | Standard Deviation | Mean BN | Standard Deviation | ||||
| 593 | 8,78 | 8,36 | 10,80 | 7,18 | ,618 | 44 | ,540 |
| 750 | 4,27 | 6,67 | 3,76 | 7,79 | ,808 | 44 | ,424 |
| 937 | 0,89 | 4,87 | 2,07 | 5,41 | -1,350 | 44 | ,184 |
| 1187 | -0,20 | 4,86 | 0,80 | 5,85 | ,369 | 44 | ,714 |
| 1500 | -3,20 | 5,28 | -1,91 | 5,74 | -1,154 | 44 | ,255 |
| 1906 | -5,73 | 4,01 | -4,31 | 4,13 | -,890 | 44 | ,378 |
| 2406 | -8,16 | 2,77 | -7,44 | 3,66 | -1,172 | 44 | ,248 |
| 3031 | -9,82 | 4,26 | -8,84 | 3,58 | -1,510 | 44 | ,138 |
| 3812 | -9,73 | 3,36 | -9,09 | 2,87 | -,961 | 44 | ,342 |
| 4812 | -8,27 | 2,78 | -8,60 | 2,13 | -1,211 | 44 | ,232 |
| 6031 | -7,31 | 2,08 | -7,62 | 2,22 | -1,091 | 44 | ,281 |
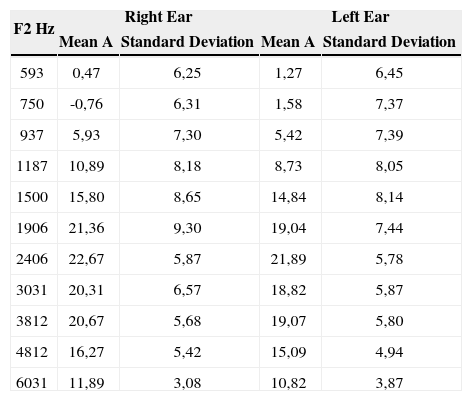
mean values and standard deviation of the distortion product difference with the background noise (a=DP-BN) obtained for the right and left ears – control group
| F2 Hz | Right Ear | Left Ear | ||
|---|---|---|---|---|
| Mean A | Standard Deviation | Mean A | Standard Deviation | |
| 593 | 0,47 | 6,25 | 1,27 | 6,45 |
| 750 | -0,76 | 6,31 | 1,58 | 7,37 |
| 937 | 5,93 | 7,30 | 5,42 | 7,39 |
| 1187 | 10,89 | 8,18 | 8,73 | 8,05 |
| 1500 | 15,80 | 8,65 | 14,84 | 8,14 |
| 1906 | 21,36 | 9,30 | 19,04 | 7,44 |
| 2406 | 22,67 | 5,87 | 21,89 | 5,78 |
| 3031 | 20,31 | 6,57 | 18,82 | 5,87 |
| 3812 | 20,67 | 5,68 | 19,07 | 5,80 |
| 4812 | 16,27 | 5,42 | 15,09 | 4,94 |
| 6031 | 11,89 | 3,08 | 10,82 | 3,87 |
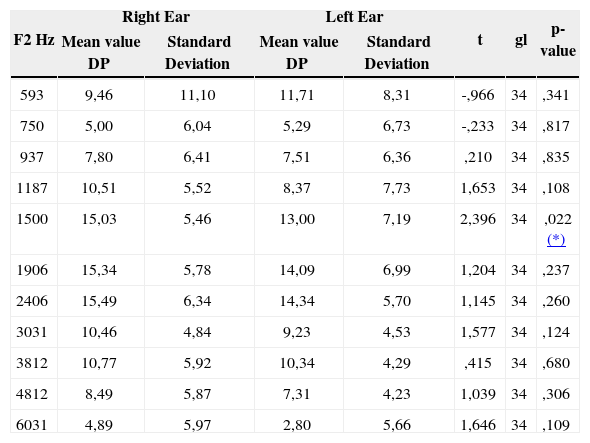
mean values, standard deviation and student t test (paired samples) in order to compare DP (distortion product) mean values obtained for right and left ears – study group
| F2 Hz | Right Ear | Left Ear | t | gl | p-value | ||
|---|---|---|---|---|---|---|---|
| Mean value DP | Standard Deviation | Mean value DP | Standard Deviation | ||||
| 593 | 9,46 | 11,10 | 11,71 | 8,31 | -,966 | 34 | ,341 |
| 750 | 5,00 | 6,04 | 5,29 | 6,73 | -,233 | 34 | ,817 |
| 937 | 7,80 | 6,41 | 7,51 | 6,36 | ,210 | 34 | ,835 |
| 1187 | 10,51 | 5,52 | 8,37 | 7,73 | 1,653 | 34 | ,108 |
| 1500 | 15,03 | 5,46 | 13,00 | 7,19 | 2,396 | 34 | ,022 (*) |
| 1906 | 15,34 | 5,78 | 14,09 | 6,99 | 1,204 | 34 | ,237 |
| 2406 | 15,49 | 6,34 | 14,34 | 5,70 | 1,145 | 34 | ,260 |
| 3031 | 10,46 | 4,84 | 9,23 | 4,53 | 1,577 | 34 | ,124 |
| 3812 | 10,77 | 5,92 | 10,34 | 4,29 | ,415 | 34 | ,680 |
| 4812 | 8,49 | 5,87 | 7,31 | 4,23 | 1,039 | 34 | ,306 |
| 6031 | 4,89 | 5,97 | 2,80 | 5,66 | 1,646 | 34 | ,109 |
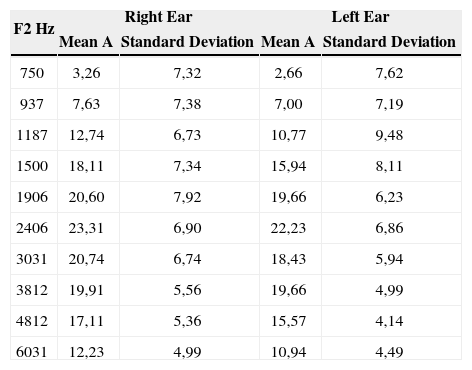
mean values and standard deviation of the distortion product difference with the background noise (a=DP-BN) obtained for the right and left ears – study group
| F2 Hz | Right Ear | Left Ear | ||
|---|---|---|---|---|
| Mean A | Standard Deviation | Mean A | Standard Deviation | |
| 750 | 3,26 | 7,32 | 2,66 | 7,62 |
| 937 | 7,63 | 7,38 | 7,00 | 7,19 |
| 1187 | 12,74 | 6,73 | 10,77 | 9,48 |
| 1500 | 18,11 | 7,34 | 15,94 | 8,11 |
| 1906 | 20,60 | 7,92 | 19,66 | 6,23 |
| 2406 | 23,31 | 6,90 | 22,23 | 6,86 |
| 3031 | 20,74 | 6,74 | 18,43 | 5,94 |
| 3812 | 19,91 | 5,56 | 19,66 | 4,99 |
| 4812 | 17,11 | 5,36 | 15,57 | 4,14 |
| 6031 | 12,23 | 4,99 | 10,94 | 4,49 |
Study of the distortion product amplitudes and background noise in function of the gender variable in both the control and the study groups
We analyzed the average with standard deviation measures for distortion product - evoked otoacoustic emissions and background noise in relation to gender for each group (study and control).
Boys presented better distortion product average amplitudes when compared to girls in the F2 frequencies of 1187 KHz and 1500 KHz for the control group, while girls had better distortion product amplitude averages when compared to boys in the F2 frequency of 2406 KHz. There was no statistically significant difference for background noise insofar as gender is concerned for both groups.
Comparative study of background noise and distortion product amplitudes between the control and study groups
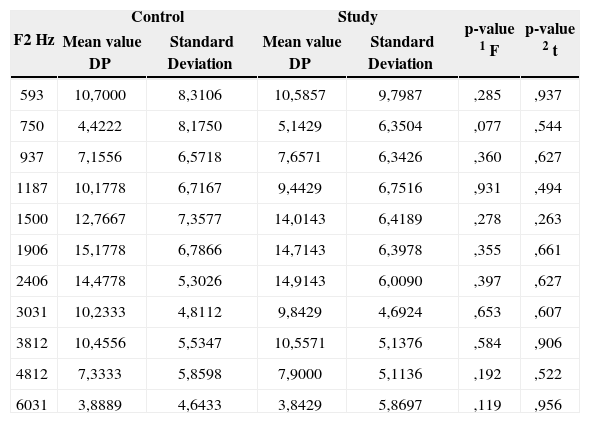
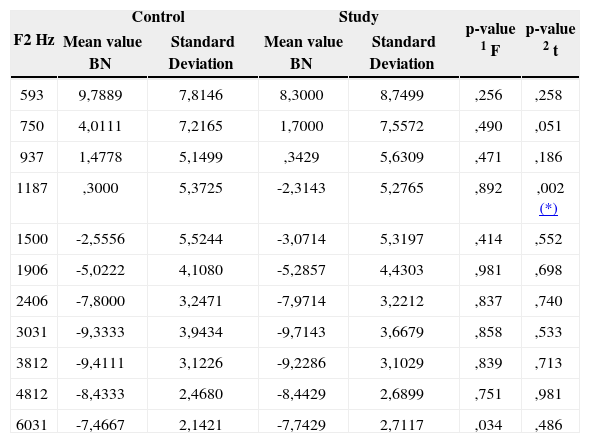
Considering both ears together for the assessed group. There was no statistically significant difference between the two groups in relation to the averages of response amplitudes in distortion product. Both for the control and the study groups, background noise presented positive values for the low frequencies and negative values for the (F2) frequencies starting at 1500Hz for the control group and at 1187Hz for the study group.
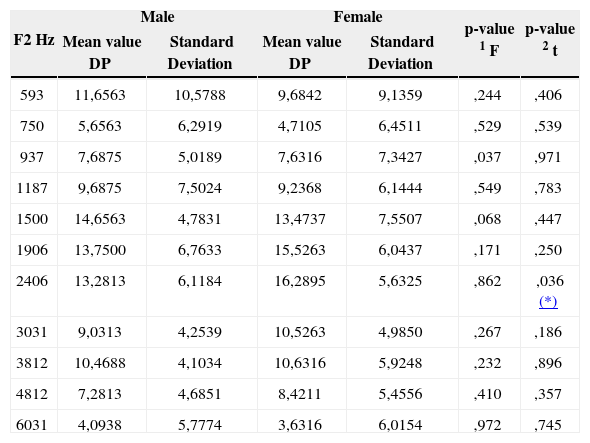
mean values, standard deviation and t-student test (independent samples) in order to compare DP mean values assessed by gender – study group
| F2 Hz | Male | Female | p-value 1 F | p-value 2 t | ||
|---|---|---|---|---|---|---|
| Mean value DP | Standard Deviation | Mean value DP | Standard Deviation | |||
| 593 | 11,6563 | 10,5788 | 9,6842 | 9,1359 | ,244 | ,406 |
| 750 | 5,6563 | 6,2919 | 4,7105 | 6,4511 | ,529 | ,539 |
| 937 | 7,6875 | 5,0189 | 7,6316 | 7,3427 | ,037 | ,971 |
| 1187 | 9,6875 | 7,5024 | 9,2368 | 6,1444 | ,549 | ,783 |
| 1500 | 14,6563 | 4,7831 | 13,4737 | 7,5507 | ,068 | ,447 |
| 1906 | 13,7500 | 6,7633 | 15,5263 | 6,0437 | ,171 | ,250 |
| 2406 | 13,2813 | 6,1184 | 16,2895 | 5,6325 | ,862 | ,036 (*) |
| 3031 | 9,0313 | 4,2539 | 10,5263 | 4,9850 | ,267 | ,186 |
| 3812 | 10,4688 | 4,1034 | 10,6316 | 5,9248 | ,232 | ,896 |
| 4812 | 7,2813 | 4,6851 | 8,4211 | 5,4556 | ,410 | ,357 |
| 6031 | 4,0938 | 5,7774 | 3,6316 | 6,0154 | ,972 | ,745 |
Note: (1) Levene test for equality of variances, (2) t-Student test for independent samples
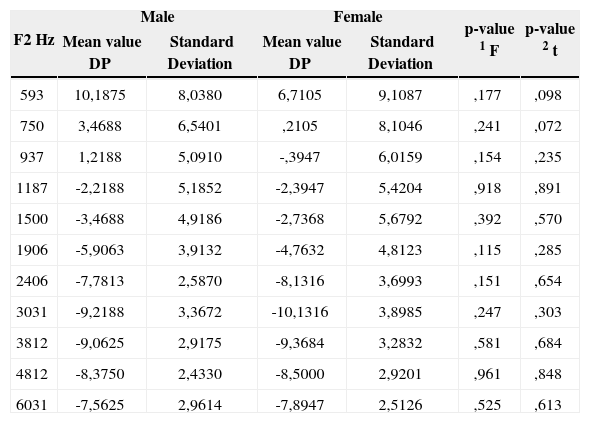
mean values, standard deviation and t-student test (independent samples) in order to compare BN mean values assessed by gender – study group
| F2 Hz | Male | Female | p-value 1 F | p-value 2 t | ||
|---|---|---|---|---|---|---|
| Mean value DP | Standard Deviation | Mean value DP | Standard Deviation | |||
| 593 | 10,1875 | 8,0380 | 6,7105 | 9,1087 | ,177 | ,098 |
| 750 | 3,4688 | 6,5401 | ,2105 | 8,1046 | ,241 | ,072 |
| 937 | 1,2188 | 5,0910 | -,3947 | 6,0159 | ,154 | ,235 |
| 1187 | -2,2188 | 5,1852 | -2,3947 | 5,4204 | ,918 | ,891 |
| 1500 | -3,4688 | 4,9186 | -2,7368 | 5,6792 | ,392 | ,570 |
| 1906 | -5,9063 | 3,9132 | -4,7632 | 4,8123 | ,115 | ,285 |
| 2406 | -7,7813 | 2,5870 | -8,1316 | 3,6993 | ,151 | ,654 |
| 3031 | -9,2188 | 3,3672 | -10,1316 | 3,8985 | ,247 | ,303 |
| 3812 | -9,0625 | 2,9175 | -9,3684 | 3,2832 | ,581 | ,684 |
| 4812 | -8,3750 | 2,4330 | -8,5000 | 2,9201 | ,961 | ,848 |
| 6031 | -7,5625 | 2,9614 | -7,8947 | 2,5126 | ,525 | ,613 |
Note: (1) Levene test for variances analyses, (2) t-Student test for independent samples.
The choice for distortion product - evoked otoacoustic emissions was based on their wide clinical application:
- 1)
in assessing the cochlear external hair cells function11;
- 2)
it is frequency-specific;
- 3)
recommended for use in babies and
- 4)
are able to detect changes in auditory threshold even before conventional tonal audiometry does9.
In order to obtain a better response amplitude and less background noise interference, distortion productevoked otoacoustic emissions were applied to the population studied, following the criteria: F2/F1 equal to 1.2, geometric average of the F1 and F2 primary frequencies in 2F1-F2; and the stimuli intensities of F1 and F2 were of 65 dB SPL and 55 dB SPL (that is: L1=L2-10), respectively4.
The distortion products-response-amplitude for both the right and left ears in the control group varied according to frequency F2, always presenting positive values in all the frequencies tested, the highest values were seen in the frequencies of 1500 Hz, 1906 Hz, 2406 Hz, 3031 Hz and 3812 Hz for both ears. The highest peak of response amplitude was seen at 1906 Hz and 2406 Hz, with values of 15.62 dBSPL and 14.51 dBSPL for the right ear, and values of 14.73 dBSPL and 14.44 dBSPL for the left ear in the same frequencies, respectively.
Authors such as Bonfils et al.14 (1993) and Abdala12 (1996) also found distortion product average amplitude responses in normal children with positive values in all the F2 frequencies tested.
As to the maximum response amplitude peaks, the literature shows values of 17.8 dBSPL in 2 KHz, of 16 dBSPL in 1.5 KHz12, of 17.26 dBSPL in 2 KHz, of 16.8 dBSPL in 1.5 KHz and of 17.4 dBSPL in 2 KHz. The results of the present investigation, in relation to the maximum distortion product amplitude response, are in agreement with those found in the literature; in other words, in the F2 frequency ranged around 2 KHz.
It was also seen that background noise average measures for both ears in the control group presented positive and high values in the lower frequencies and decreased as the frequencies become higher, taking on negative values starting in the frequency of 1187 Hz for the right ear and 1500 Hz for the left ear. The highest peak for negative values for background noise was seen in the frequencies of 3031 Hz and 3812 Hz; with values of -9.82 dBSPL and -9.73 dBSPL for the right ear; and values of -8.84 dBSPL and -9.09 dBSPL for the left ear.
Results from the present investigation agree with those who found background noise taking on higher values in the lower frequencies. Bonfils et al.14 (1993) reported that the background noise had higher values in the lower frequencies and lower values in the higher frequencies. The same thing was noticed in the present study.
In regards to the difficulty in recording distortion product responses in the F2 frequencies, in the present investigation we observed that below the F2 frequency of 1500 Hz, despite positive values for response average amplitudes, background noise was high and hampered response interpretation.
In relation to average amplitudes, given by the distortion product (signal) response amplitude difference with the background noise amplitude (table 7), it was observed that values equal to or above 6dBSPL were present starting in the F2 frequency equal to or higher than 1187 Hz for the right and left ears, showing maximum peaks in 1906 Hz and 2406 Hz with values of 21.36 dBSPL and 22.67 dBSPL for the right ear and in 2406 Hz and 3812 Hz with values of 21.89 dBSPL and 19.07 dBSPL for the left ear, respectively.
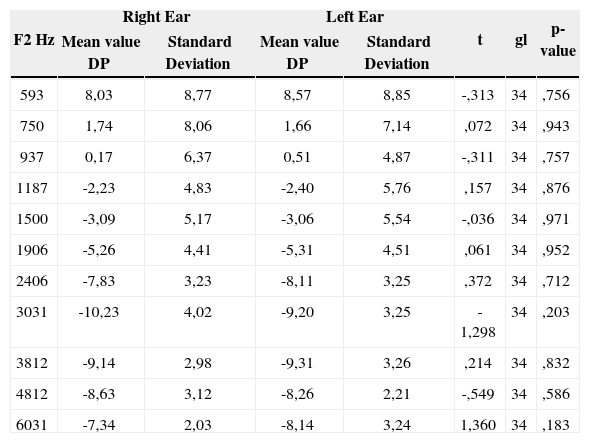
mean values, standard deviation and student t test (paired samples) in order to compare BN (background noise) mean values obtained for right and left ears – study group
| F2 Hz | Right Ear | Left Ear | t | gl | p-value | ||
|---|---|---|---|---|---|---|---|
| Mean value DP | Standard Deviation | Mean value DP | Standard Deviation | ||||
| 593 | 8,03 | 8,77 | 8,57 | 8,85 | -,313 | 34 | ,756 |
| 750 | 1,74 | 8,06 | 1,66 | 7,14 | ,072 | 34 | ,943 |
| 937 | 0,17 | 6,37 | 0,51 | 4,87 | -,311 | 34 | ,757 |
| 1187 | -2,23 | 4,83 | -2,40 | 5,76 | ,157 | 34 | ,876 |
| 1500 | -3,09 | 5,17 | -3,06 | 5,54 | -,036 | 34 | ,971 |
| 1906 | -5,26 | 4,41 | -5,31 | 4,51 | ,061 | 34 | ,952 |
| 2406 | -7,83 | 3,23 | -8,11 | 3,25 | ,372 | 34 | ,712 |
| 3031 | -10,23 | 4,02 | -9,20 | 3,25 | -1,298 | 34 | ,203 |
| 3812 | -9,14 | 2,98 | -9,31 | 3,26 | ,214 | 34 | ,832 |
| 4812 | -8,63 | 3,12 | -8,26 | 2,21 | -,549 | 34 | ,586 |
| 6031 | -7,34 | 2,03 | -8,14 | 3,24 | 1,360 | 34 | ,183 |
We may see that the best signal/noise difference amplitude averages are obtained in the frequency range of F2 where the best distortion product response amplitudes are present, coinciding with the lower values for background noise.
When we applied the t-Student (paired samples) test to compare the distortion product amplitude responses and those of the background noise for the right and left ears, we did not observe statistically significant differences (p < 0.05) in any of the F2 frequencies tested.
In the present investigation, the distortion product amplitude averages for both, the right and left ears of the study group varied according to F2 frequency, presenting positive values in all tested frequencies of 1187 Hz, 1500 Hz, 1906 Hz, 2406 Hz, 3031 Hz and 3812 Hz of the right ear and in the frequencies of 593 Hz, 1500 Hz, 1906 Hz, 2406 Hz and 3812 Hz of the left ear. A maximum response amplitude peak was seen at 1906 Hz and 2406 Hz with values of 15.03 dBSPL and 15.34 dBSPL for the right ear, and values of 14.09 dBSPL and 14.34 dBSPL for the left ear, respectively.
By using the t-Student (paired samples) test in order to compare the distortion product amplitude response averages evaluated for the left and right ears of the study group, there was a statistically significant difference between the ears only in the F2 frequency of 1500 Hz, and the right ear presented better response amplitude averages when compared to the left ear. As seen above, there are controversies in relation to the ear side that presents the best response amplitudes, in other words, authors said they found better response amplitudes for the right ears, while others observed response amplitude averages similar for both the right and left ears. In the present investigation, only one F2 frequency (1500 Hz) presented response amplitude averages that were better for the right ear when compared to the left ear in the study group.
We observed that the background noise measures for both the right and left ears of the study group presented positive values for the lower frequencies, with high values in the F2 frequency of 593 Hz. It was also observed that the background noise decreased as the frequencies became higher, taking on negative values starting from F2 frequency of 1187 Hz for both ears (Table 9). Maximum peak of negative values for background noise occurred in the frequencies of 3031 Hz and 3812 Hz, with values of -10.23 dBSPL and -9.14 dBSPL, for the right ear, and with values of -9.20 dBSPL and -9.31 dBSPL, for the left ear.
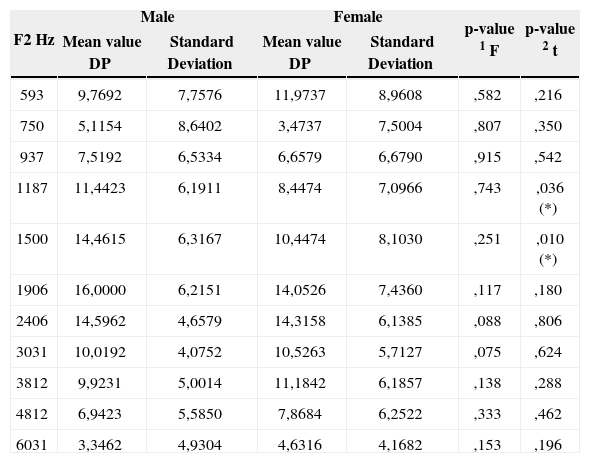
mean values, standard deviation and student t test (independent samples) in order to compare DP (distortion product) mean values assessed by gender – control group
| F2 Hz | Male | Female | p-value 1 F | p-value 2 t | ||
|---|---|---|---|---|---|---|
| Mean value DP | Standard Deviation | Mean value DP | Standard Deviation | |||
| 593 | 9,7692 | 7,7576 | 11,9737 | 8,9608 | ,582 | ,216 |
| 750 | 5,1154 | 8,6402 | 3,4737 | 7,5004 | ,807 | ,350 |
| 937 | 7,5192 | 6,5334 | 6,6579 | 6,6790 | ,915 | ,542 |
| 1187 | 11,4423 | 6,1911 | 8,4474 | 7,0966 | ,743 | ,036 (*) |
| 1500 | 14,4615 | 6,3167 | 10,4474 | 8,1030 | ,251 | ,010 (*) |
| 1906 | 16,0000 | 6,2151 | 14,0526 | 7,4360 | ,117 | ,180 |
| 2406 | 14,5962 | 4,6579 | 14,3158 | 6,1385 | ,088 | ,806 |
| 3031 | 10,0192 | 4,0752 | 10,5263 | 5,7127 | ,075 | ,624 |
| 3812 | 9,9231 | 5,0014 | 11,1842 | 6,1857 | ,138 | ,288 |
| 4812 | 6,9423 | 5,5850 | 7,8684 | 6,2522 | ,333 | ,462 |
| 6031 | 3,3462 | 4,9304 | 4,6316 | 4,1682 | ,153 | ,196 |
Note: (1) Levene test for equality of variances, (2) t-Student test for independent samples.
When we applied the t-Student (paired samples) test to compare background noises assessed for right and left ears, we did not find statistically significant differences between the ears, corroborating some aforementioned authors.
The amplitude averages of the signal/noise difference in the study group for the right and left ears presented values equal to or superior than 6 dBSPL from the F2 frequency of 937 Hz, showing maximum peaks of 20.60 dBSPL; 23.21 dBSPL and 20.74 dBSPL in the frequencies of 1906 Hz, 2406 Hz and 3031 Hz, for the right ear; and of 19.66 dBSPL; 22.23 dBSPL and 19.66 dBSPL in the frequencies of 1906 Hz, 2406 Hz and 3812 Hz, for the left ear, respectively (Table 10).
mean values, standard deviation and t-student test (independent samples) in order to compare BN assessed by gender – control group
| F2 Hz | Male | Female | p-value 1 F | p-value 2 t | ||
|---|---|---|---|---|---|---|
| Mean value BN | Standard Deviation | Mean value BN | Standard Deviation | |||
| 593 | 9,3846 | 7,0909 | 10,3421 | 8,7774 | ,021 | ,582 |
| 750 | 4,0962 | 7,3518 | 3,8947 | 7,1236 | ,886 | ,897 |
| 937 | 1,9231 | 4,7023 | 0,8684 | 5,7147 | ,096 | ,340 |
| 1187 | 0,1346 | 5,7804 | 0,5263 | 4,8253 | ,367 | ,735 |
| 1500 | -2,1923 | 5,7770 | -3,0526 | 5,1933 | ,742 | ,469 |
| 1906 | -4,9038 | 4,4336 | -5,1842 | 3,6676 | ,289 | ,751 |
| 2406 | -8,0769 | 2,9362 | -7,4211 | 3,6364 | ,981 | ,347 |
| 3031 | -9,0577 | 3,8573 | -9,7105 | 4,0797 | ,775 | ,441 |
| 3812 | -8,9231 | 2,8343 | -10,0789 | 3,4041 | ,114 | ,083 |
| 4812 | -8,5385 | 2,3218 | -8,2895 | 2,6803 | ,235 | ,639 |
| 6031 | -7,7308 | 2,4344 | -7,1053 | 1,6240 | ,008 | ,148 |
Note: (1) Levene test for equality of variances, (2) t-Student test for independent samples
The best signal/noise ratio amplitude mean values were seen in the frequency range where the distortion product response amplitudes were broader and the background noise was lower.
When we compared the response amplitude mean values by the t-Student test (independent samples) in relation to gender for the control group, we observed a statistically significant difference (p>0.05) in two F2 frequencies only (1187 Hz and 1500 Hz), and males had better average values (11.44 dBSPL and 14.46 dBSPL) when compared to females (8.44 dBSPL and 10.44 dBSPL).
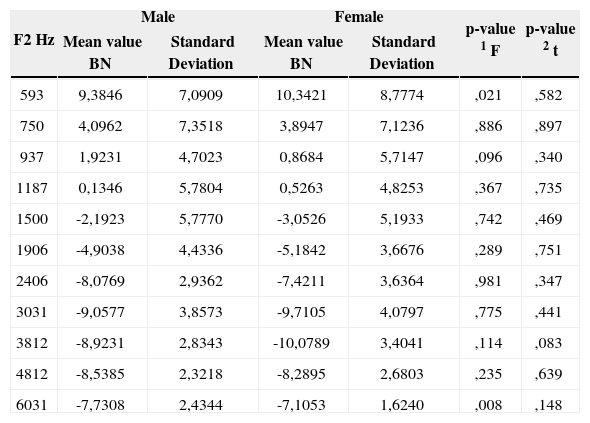
In regards of background noise, the mean values did not present statistically significant differences between males and females compared to the control group.
For the study group response amplitude mean values (Table 13), the t-Student test (independent samples) for gender comparison, showed a statistically significant difference in one F2 frequency only (2406 Hz); when females presented a better mean value (16.28 dBSPL) when compared to males (13.28 dBSPL).
mean values, standard deviation and t-student test (independent samples) in order to compare DP mean values between the control and study groups
| F2 Hz | Control | Study | p-value 1 F | p-value 2 t | ||
|---|---|---|---|---|---|---|
| Mean value DP | Standard Deviation | Mean value DP | Standard Deviation | |||
| 593 | 10,7000 | 8,3106 | 10,5857 | 9,7987 | ,285 | ,937 |
| 750 | 4,4222 | 8,1750 | 5,1429 | 6,3504 | ,077 | ,544 |
| 937 | 7,1556 | 6,5718 | 7,6571 | 6,3426 | ,360 | ,627 |
| 1187 | 10,1778 | 6,7167 | 9,4429 | 6,7516 | ,931 | ,494 |
| 1500 | 12,7667 | 7,3577 | 14,0143 | 6,4189 | ,278 | ,263 |
| 1906 | 15,1778 | 6,7866 | 14,7143 | 6,3978 | ,355 | ,661 |
| 2406 | 14,4778 | 5,3026 | 14,9143 | 6,0090 | ,397 | ,627 |
| 3031 | 10,2333 | 4,8112 | 9,8429 | 4,6924 | ,653 | ,607 |
| 3812 | 10,4556 | 5,5347 | 10,5571 | 5,1376 | ,584 | ,906 |
| 4812 | 7,3333 | 5,8598 | 7,9000 | 5,1136 | ,192 | ,522 |
| 6031 | 3,8889 | 4,6433 | 3,8429 | 5,8697 | ,119 | ,956 |
Note: (1) Levene test for equality of variances, (2) t-Student test for independent samples.
There was no statistically significant difference among background mean values between the genders (table 14), when the t-Student test was used (independent samples).
mean values, standard deviation and t-student test (independent samples) in order to compare BN mean values between the control and study groups
| F2 Hz | Control | Study | p-value 1 F | p-value 2 t | ||
|---|---|---|---|---|---|---|
| Mean value BN | Standard Deviation | Mean value BN | Standard Deviation | |||
| 593 | 9,7889 | 7,8146 | 8,3000 | 8,7499 | ,256 | ,258 |
| 750 | 4,0111 | 7,2165 | 1,7000 | 7,5572 | ,490 | ,051 |
| 937 | 1,4778 | 5,1499 | ,3429 | 5,6309 | ,471 | ,186 |
| 1187 | ,3000 | 5,3725 | -2,3143 | 5,2765 | ,892 | ,002 (*) |
| 1500 | -2,5556 | 5,5244 | -3,0714 | 5,3197 | ,414 | ,552 |
| 1906 | -5,0222 | 4,1080 | -5,2857 | 4,4303 | ,981 | ,698 |
| 2406 | -7,8000 | 3,2471 | -7,9714 | 3,2212 | ,837 | ,740 |
| 3031 | -9,3333 | 3,9434 | -9,7143 | 3,6679 | ,858 | ,533 |
| 3812 | -9,4111 | 3,1226 | -9,2286 | 3,1029 | ,839 | ,713 |
| 4812 | -8,4333 | 2,4680 | -8,4429 | 2,6899 | ,751 | ,981 |
| 6031 | -7,4667 | 2,1421 | -7,7429 | 2,7117 | ,034 | ,486 |
Note: (1) Levene test for equality of variances, (2) t-Student test for independent samples.
According to what was presented, we can notice that while males had better distortion product mean amplitude responses in two frequencies when compared to the control group, the same thing did not happen for the study group, in which women had better distortion product amplitude mean values in one frequency only.
We can see that exposure to occupational noise during pregnancy did not affect the hearing of children born from exposed mothers. The literature is scarce in studies about newborns’ and infants’ hearing, whose mothers were exposed to occupational noise during pregnancy. Lalande et al.27 (1986), in their study, stated that the proportion of children with significant hearing loss in 4 KHz was 3 to 4 times greater when their mothers had been exposed to sound pressures of 85 to 95 dBSPL in comparison to lower noise doses, and also that the lower frequencies are more affected.
Ando and Hattori23 (1970) reported on the greater skill the child had in adapting to the growing environmental noise when their mothers were exposed to noise during pregnancy, however they did not evaluate possible hearing loss. Gerhardt and Abrams21 (2000) reported hearing loss in the fetuses of mothers who were exposed to noise during pregnancy. However, in our study we did not notice hearing loss in fetuses from mothers exposed to occupational noise.
CONCLUSIONWe did not notice a harmful effect on the hearing of children born from women exposed to occupational noise during pregnancy - evaluated by means of distortion product otoacoustic emissions, when compared to children born from women who were not exposed to occupational noise during pregnancy.
Paper submitted to the ABORL-CCF SGP (Management Publications System) on April 17th, 2007 and accepted for publication on April 18th, 2007. cod. 4454.
gology is pleased to honor the reviewers


- Home
- All contents
- Publish your article
- About the journal
- Metrics