


Studies about cortical auditory evoked potentials using the speech stimuli in normal hearing individuals are important for understanding how the complexity of the stimulus influences the characteristics of the cortical potential generated.
ObjectiveTo characterize the cortical auditory evoked potential and the P3 auditory cognitive potential with the vocalic and consonantal contrast stimuli in normally hearing individuals.
Method31 individuals with no risk for hearing, neurologic and language alterations, in the age range between 7 and 30 years, participated in this study. The cortical auditory evoked potentials and the P3 auditory cognitive one were recorded in the Fz and Cz active channels using consonantal (/ba/-/da/) and vocalic (/i/-/a/) speech contrasts. Design: A cross-sectional prospective cohort study.
ResultsWe found a statistically significant difference between the speech contrast used and the latencies of the N2 (p = 0.00) and P3 (p = 0.00) components, as well as between the active channel considered (Fz/Cz) and the P3 latency and amplitude values. These correlations did not occur for the exogenous components N1 and P2.
ConclusionThe speech stimulus contrast, vocalic or consonantal, must be taken into account in the analysis of the cortical auditory evoked potential, N2 component, and auditory cognitive P3 potential.
The study of the P3 auditory cognitive evoked potential, enables the assessment of the neurophysiological cognitive processes which happen in the cerebral cortex, such as memory and auditory attention1. Since this is an objective method, its clinical applicability has been shown in different neurological and mental conditions, alterations in hearing, language, learning and others2-6.
Two auditory stimuli are utilized in the oddball paradigm, one rare and one that is frequent; they have a contrast between each other and are built based on frequency, intensity, meaning or category. Using two recording channels, it is possible to observe the N1, P2 e N2 cortical potentials for the frequent stimuli, and the P3component for the rare stimulus. The number used to name these components pertains to the order of occurrence in which these potentials are recorded, and the letters are used to characterize positive (P) and negative (N) peaks. It is important to stress that the P3 is considered a cognitive potential different from the others, since it corresponds to the electrical activity which happens in the auditory system when there is discrimination of the rare stimulus among the frequencies.
Studies have characterized the P3 component as to latency and amplitude as it is evoked by pure tones in individuals who can hear. However, the acoustic signal processing happens in a very different way vis-à-vis verbal and non-verbal sounds7-10, and it is very difficult to generalize auditory processing information of a simple stimulus and a more complex one, like speech11.
The P3 cognitive auditory evoked potential generated by speech has been utilized to provide speech signal processing information when the behavioral assessment is not an accurate method, besides helping to pinpoint detection or discrimination alterations, and such information may guide the therapeutic rehabilitation of the individual12.
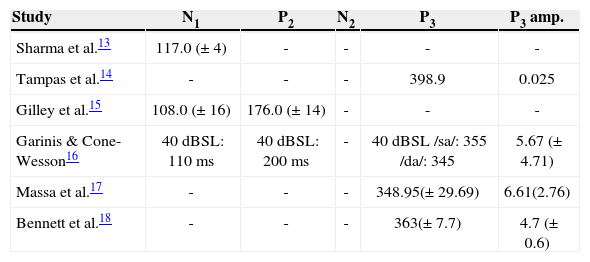
Thus, studies involving auditory evoked potentials with speech stimuli are important in order to understand how the stimulus complexity influences the characteristics of the potential generated, such as latency and amplitude. Table 1 depicts the latency values from the P3 cognitive and cortical auditory evoked potential latency values, as well as the amplitude values as evoked by speech (syllables) stimuli in adults with normal hearing.
Mean values of the N1, P2, N2 e P3 component latencies (milliseconds) and amplitude values (μV) from the P3 component in adults.
| Study | N1 | P2 | N2 | P3 | P3 amp. |
|---|---|---|---|---|---|
| Sharma et al.13 | 117.0 (± 4) | - | - | - | - |
| Tampas et al.14 | - | - | - | 398.9 | 0.025 |
| Gilley et al.15 | 108.0 (± 16) | 176.0 (± 14) | - | - | - |
| Garinis & Cone-Wesson16 | 40 dBSL: 110 ms | 40 dBSL: 200 ms | - | 40 dBSL /sa/: 355 /da/: 345 | 5.67 (± 4.71) |
| Massa et al.17 | - | - | - | 348.95(± 29.69) | 6.61(2.76) |
| Bennett et al.18 | - | - | - | 363(± 7.7) | 4.7 (± 0.6) |
amp.: amplitude.
The goal of the present paper was to characterize cortical auditory evoked potentials and the P3 cognitive auditory potentials from speech stimulus with vocalic and consonantal contrasts in normal hearing individuals.
METHODThis is a cross-sectional and prospective study carried out with the approval of the Ethics Committee, process # 069/2003. All the individuals assessed, or their guardians, signed the Informed Consent Form prior to being submitted to the exam.
We assessed 31 normal hearing individuals, without past disorders putting them in risk of developing auditory, neurological and language disorders, within the age range between 7 and 30 years, 13 females and 18 males.
The lack of hearing loss was proven by the auditory threshold of ≤ 25 dBHL upon threshold tonal audiometry, 92% scores for monosyllable words in the speech recognition index (SRI), type A tympanometry curve and acoustic reflex between 70 and 90 dBSL. We used the 622 Madsen audiometer®, with TDH-39 headphones, calibrated in the ANSI-69 standard and the Interacoustics AZ7® immittance audiometer.
During the test, the individuals remained lying down in a gurney, in the dorsal position, and were instructed to keep their eyes as fixed as possible in order to reduce the artifact caused by eye movement. As we identified the rare stimulus among the frequent ones, the individuals were instructed to perform a simple motor action (raise the hand).
The simultaneous recording of the N1/P2 e N2/P3complexes in channels Fz and Cz was considered as a criterion to define the presence of cortical auditory evoked potentials and the P3 cognitive auditory potential. We used the Biologic's Evoked Potential System® (EP) with the parameters described on Table 2.
Parameters utilized in the study of cortical evoked potentials and the P3 cognitive auditory potential.
| Assessment parameters | |
|---|---|
| Type of stimulus | Speech stimulus (80% frequent and 20% rare) |
| Stimulus frequency | Vowel contrast: /i/ (frequent); /a/ (rare) Consonant contrast: /ba/ (frequent); /da/ (rare) |
| Stimulus presentation rate | 1 stimulus per second |
| Electrode positioning | Fz and Cz (active); A1/A2 (reference) |
| Pre-amplifer | Channels 1 and 2: input 1 - active electrodes; input 2 - reference electrodes (jumper) |
| Impedance | ≤ 5 kΩ (individual); ≤ 2 kΩ (between electrodes) |
| Band-pass flter | 1-25 Hz |
| Window | 520 ms |
| Gain | 75000 |
| Intensity | 70 dBHL, binaural stimulation |
| Transducer | 3rd insertion phone |
The speech sample was collected in an acoustically treated room inside a lab. The emissions were recorded by means of a unidirectional microphone, directly on the computer board, through the Praat® (www.praat.org) free software, with 22 kHz sampling. We asked the speaker (22 year-old male with a fluid voice quality) to utter the emissions naturally. In the beginning, we worked on the contrast by means of the /ba/-/da/ articulation point. By the spectral and temporal definition, the /ba/ was setup as a frequent stimulus, and the /da/ as the rare one. The [ba] and [da] syllables were taken from uttering the words [ba’ba] and [da’da], respectively, corresponding to the second syllable. From the isolated syllable, we found the F1, F2and F3 values in their initial and stable portions. With the bandwidth values of the forming frequencies stable regions we compiled a Praat script (version 4.2.31) and we resynthesized each syllable. The duration of the [ba] and [da] syllables was 180 ms. The /i/-/a/ meeting of vowels was established by the frequencies from formants F1 and F2 and by a shorter F3 extension. Vowels [a] and [i] were taken from the isolated utterance of syllables [pa] and [pi], respectively. In each syllable of the vowel region, we collected two glottic cycles with spectral stability, and in the Matlab® (version 6.0.0.88), we replicated these cycles so as to correspond to the 150 ms vowel utterance. The vowels were created in the Praat® with a script similar to what was previously described for the syllables. The linguistic stimuli which were previously produced, handled and recorded in a CD by the Lab were digitalized and inserted in the unit C of the computer connected to the software of the Biologic's Evoked Potential System® (EP). The stimulus order and level of presentation were randomly handled by the aforementioned software.
In order to assess the results, we considered the absolute latency of the cortical auditory evoked potentials, N1, P2 and N2 components and P3 cognitive auditory, as well as the P3 component amplitude, obtained from channels Fz and Cz.
We compared the means among the types of channel and stimuli and the variable factors (amplitude and latency) utilizing a variance analysis model with repeated measures with two factors, ANOVA.
RESULTSFigure 1 depicts an example of the recording obtained from studying the cortical auditory evoked potential and the P3 cognitive auditory potential in the Fz and Cz channels.

Upon investigating the occurrence of the records from N1, P2, N2 and P3 components, considering sample breaking down into the age ranges: 7-10 years; 11-20 years; 21-30 years, we can see the age influence on the recordings of components N1 and P2 (Table 3).
Table 4 depicts the descriptive analysis (mean, standard deviation, maximum and minimum values) of the N1, P2, N2 and P3 component latencies and P3 component amplitude, recorded from channels Fz and Cz, for all the individuals.
Descriptive analysis (mean, standard deviation, maximum and minimum values) of the N1, P2, N2 e P3 component latency values in milliseconds and e P3 component amplitude (μV) recorded in the Fz e Cz channels.
| Fz | Cz | ||||||||
|---|---|---|---|---|---|---|---|---|---|
| X | SD | Minimum | Maximum | X | SD | Minimum | Maximum | ||
| N1 | C | 104 | 40 | 66 | 197 | 105 | 42 | 45 | 197 |
| V | 106 | 17 | 75 | 139 | 103 | 33 | 50 | 170 | |
| P2 | C | 191 | 49 | 126 | 255 | 189 | 48 | 124 | 262 |
| V | 186 | 35 | 117 | 240 | 179 | 36 | 99 | 230 | |
| N2 | C | 274 | 40 | 195 | 361 | 278 | 41 | 205 | 379 |
| V | 236 | 38 | 153 | 289 | 239 | 27 | 182 | 278 | |
| P3 | C | 388 | 60 | 243 | 493 | 403 | 54 | 307 | 493 |
| V | 322 | 39 | 226 | 376 | 339 | 44 | 249 | 447 | |
| P3 amp. | C | 9 | 3 | 4 | 15 | 7 | 4 | 1 | 18 |
| V | 10 | 5 | 2 | 23 | 7 | 3 | 2 | 14 | |
X: Mean; SD: Standard deviation; amp.: Amplitude; C: Consonant; V: Vowel.
Our analysis of the association between the frequencies of components N1, P2, N2 and P3 and the P3component amplitude with the type of channel and the stimulus utilized did not show differences for the latency values of components N1 and P2. There was also a difference between the active channels (Fz and Cz) considered in the recording of the P3 component (Table 5).
Study of the association between the channel type and stimulus factors and the N1, P2, N2 e P3 component latency variables and the P3 component amplitude.
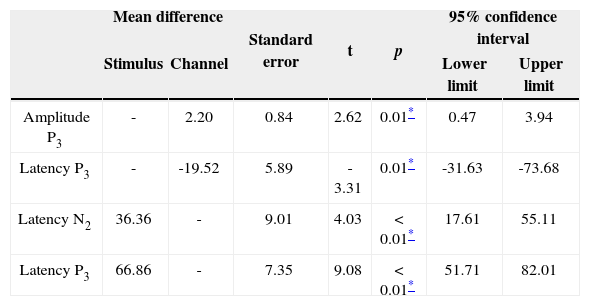
Table 6 depicts the Tukey Post-Hoc comparisons, considering the type of stimulus (consonant-vowel) for the latency of components N2 and P3 and considering the type of channel (Fz-Cz) for the amplitude and latency of the P3 component.
List of the N2 e P3 component latency values considering the type of stimulus (consonant-vowel) and the amplitude and latency values of the P3 component with the Fz-Cz channel.
In the present investigation, it was possible to obtain the recordings of the cortical auditory evoked potentials and P3 cognitive auditory potential from a speech stimulus, with good reproducibility and morphology, showing that it is a viable procedure to be employed in clinical practice (Figure 1).
Analyzing the occurrence of recording from the N1and P2 exogenous components, it was possible to notice that their presence increased with age. The N1 component was practically nonexistent in the age range of 7-10 years corroborating the literature which states that, depending on the stimulus presentation characteristics, its recording can only be obtained as of 16 years of age, approximately19. Considering that the P2 component can also be influenced by the age range20, these data show the maturation process of the structures involved in the recording of the cortical auditory evoked potential.
Nonetheless, the age range did not influence the occurrence of recordings in N2 and P3 components, which are more frequently found than the N1 and P2components in children21. The gender variable was not analyzed, because in a study we did before we showed that there are no significant differences between males and females when we investigate the P3 auditory cognitive potential22.
In investigating the cortical auditory evoked potentials, we noticed that the N1 and P2 exogenous component latencies did not depict significant differences upon considering the Fz/Cz channel and the type of stimulus utilized (/a/-/i/; /ba/-/da/). Nevertheless, for the P3 cognitive auditory potential, the channel type was a factor which influenced its latency and amplitude, as per previously reported in other studies22,23. By the same token, the type of stimulus used was an important variable in the attainment of N2 and P3 components.
The N2 component recording seems to be associated with the identification, processing and attention to the rare stimulus, with a positive correlation between the value of its latency and the level of difficulty in the discrimination task24. In our study, there was an influence of the speech stimulus on the N2 component, with higher latency values for the consonant contrast, suggesting that the degree of difficulty in the discrimination of such contrast is higher than the one found in the meeting of vowels. A similar finding was observed for the P3 component upon comparing verbal and non-verbal stimuli and in situations of difficult discrimination14,17,18,25, reinforcing the hypothesis that this task is more difficult26.
However, this finding can also be explained by the evidence that vowels and consonants are processed in different ways by the central auditory system. One study carried out in rats27 compared discrimination behavioral responses from vowels and consonants with the neural recording from the inferior colliculus and primary auditory cortex, and suggested that consonants and vowels have different representations in the brain. In humans, studies have also reported differences in the activation of central auditory system structures during the discrimination of vowels and consonants28,29. Therefore, the type of speech contrast used may reflect differently on the latency of the N2 and P3 components.
Some studies describe the reduction in the P3 component amplitude with the increase in the task's level of discrimination difficulty14,17,18,25,26. Nonetheless, this correlation was not significant in the present study.
In our series, the normal latency values for the N1, P2, N2 and P3 components for the vowel and consonant contrasts are depicted on Table 4. The comparative discussion between the values found and results from previous studies is inaccurate, because the methodologies are different, and as per shown above, assessment parameters such as type of stimulus utilized, have a significant influence on the latency values of auditory evoked potentials.
Considering that different neural structures are activated during the perception of verbal and non-verbal sounds, we stress the importance of using speech stimuli in future studies with the cortical auditory evoked potentials and the P3 cognitive auditory potential.
CONCLUSIONThe consonant or vowel-related speech stimulus, must be considered in the analysis of the N2 component of the cortical auditory evoked potentials and the P3 cognitive auditory potential. This was not observed for the N1 and P2 components.
We would like to thank the Institutional Program of Scientific Initiation Scholarships (PIBIC) from the National Council for Scientific and Technological Development (CNPq) for their support in this study, under process # 110767/2005-5.
Institutional Program of Scientific Initiation Scholarships (PIBIC) - National Council for Science and Technology Development (CNPq), under individual process: 110767/2005-5.
Paper submitted to the BJORL-SGP (Publishing Management System - Brazilian Journal of Otorhinolaryngology) on October 5, 2012; and accepted on January 19, 2013. cod. 10506.


